Agnico Eagle Mines Ltd. (AEM): Price and Financial Metrics
GET POWR RATINGS... FREE!
AEM Price/Volume Stats
Current price | $51.01 | 52-week high | $61.15 |
Prev. close | $51.11 | 52-week low | $36.69 |
Day low | $50.91 | Volume | 2,030,700 |
Day high | $52.09 | Avg. volume | 2,987,071 |
50-day MA | $55.16 | Dividend yield | 3.08% |
200-day MA | $49.44 | Market Cap | 25.22B |
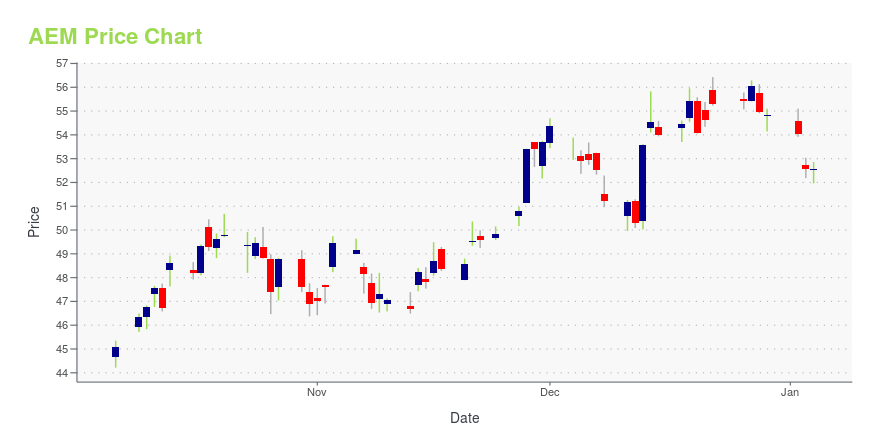
AEM Stock Price Chart Interactive Chart >
AEM POWR Grades
- AEM scores best on the Quality dimension, with a Quality rank ahead of 73.42% of US stocks.
- AEM's strongest trending metric is Quality; it's been moving up over the last 179 days.
- AEM's current lowest rank is in the Momentum metric (where it is better than 9.94% of US stocks).
AEM Stock Summary
- AGNICO EAGLE MINES LTD's stock had its IPO on January 1, 1986, making it an older stock than 93.61% of US equities in our set.
- Of note is the ratio of AGNICO EAGLE MINES LTD's sales and general administrative expense to its total operating expenses; just 4.16% of US stocks have a lower such ratio.
- Over the past twelve months, AEM has reported earnings growth of 215.66%, putting it ahead of 93.35% of US stocks in our set.
- Stocks that are quantitatively similar to AEM, based on their financial statements, market capitalization, and price volatility, are TECK, NEM, IFF, SSRM, and MUX.
- Visit AEM's SEC page to see the company's official filings. To visit the company's web site, go to www.agnicoeagle.com.
AEM Valuation Summary
- In comparison to the median Basic Materials stock, AEM's price/sales ratio is 170.59% higher, now standing at 4.6.
- AEM's EV/EBIT ratio has moved down 145.4 over the prior 243 months.
Below are key valuation metrics over time for AEM.
Stock | Date | P/S | P/B | P/E | EV/EBIT |
---|---|---|---|---|---|
AEM | 2023-05-17 | 4.6 | 1.4 | 11.4 | 9.8 |
AEM | 2023-05-16 | 4.7 | 1.4 | 11.6 | 9.9 |
AEM | 2023-05-15 | 4.8 | 1.4 | 11.9 | 10.1 |
AEM | 2023-05-12 | 4.7 | 1.4 | 11.8 | 10.0 |
AEM | 2023-05-11 | 4.7 | 1.4 | 11.8 | 10.0 |
AEM | 2023-05-10 | 4.9 | 1.5 | 12.3 | 10.4 |
AEM Growth Metrics
- Its year over year revenue growth rate is now at 23.95%.
- The 3 year revenue growth rate now stands at 96.51%.
- Its year over year price growth rate is now at -14.01%.

The table below shows AEM's growth in key financial areas (numbers in millions of US dollars).
Date | Revenue | Operating Cash Flow | Net Income to Common Stock |
---|---|---|---|
2022-12-31 | 5,741.162 | 2,096.636 | 670.249 |
2022-09-30 | 5,305.544 | 1,977.859 | 568.058 |
2022-09-30 | 5,305.544 | 1,977.859 | 568.058 |
2022-06-30 | 4,829.912 | 1,693.384 | 602.897 |
2022-06-30 | 4,829.912 | 1,693.384 | 602.897 |
2022-03-31 | 4,215.174 | 1,467.039 | 516.613 |
AEM's Quality Factors
The “Quality” component of the POWR Ratings focuses on 31 different factors of a companies fundamentals and operational strength. Here are some key insights as we drill into the specifics of these quality attributes.- AEM has a Quality Grade of C, ranking ahead of 68.86% of graded US stocks.
- AEM's asset turnover comes in at 0.341 -- ranking 15th of 47 Precious Metals stocks.
- 500 - Internal server error
The table below shows AEM's key quality metrics over time.
Period | Asset Turnover | Gross Margin | ROIC |
---|---|---|---|
2020-12-31 | 0.341 | 0.546 | 0.090 |
2019-12-31 | 0.300 | 0.500 | 0.096 |
2018-12-31 | 0.279 | 0.470 | -0.020 |
2017-12-31 | 0.300 | 0.528 | 0.059 |
2016-12-31 | 0.310 | 0.517 | 0.051 |
2015-12-31 | 0.294 | 0.499 | 0.023 |
AEM Price Target
For more insight on analysts targets of AEM, see our AEM price target page. And for a list of of all stocks sorted by upside potential based on analyst target price, see our Top Price Target page.
Average Price Target | $76.63 | Average Broker Recommendation | 1.53 (Moderate Buy) |
Agnico Eagle Mines Ltd. (AEM) Company Bio
Agnico Eagle Mines Limited is a Canadian-based gold producer with operations in Canada, Finland and Mexico and exploration and development activities extending to the United States. Agnico Eagle has full exposure to higher gold prices consistent with its policy of no-forward gold sales. As of 2017, it has paid a cash dividend every year since 1983. (Source:Wikipedia)
Latest AEM News From Around the Web
Below are the latest news stories about AGNICO EAGLE MINES LTD that investors may wish to consider to help them evaluate AEM as an investment opportunity.
The Ones That Didn't Get Away — 10 Stocks Serve Up Buy ZonesWhile SMCI, Monster and others have already taken off, Wendy's and Core & Main lead among stocks to watch that are setting up. |
Agnico Eagle Mines (NYSE:AEM) Will Pay A Dividend Of $0.40The board of Agnico Eagle Mines Limited ( NYSE:AEM ) has announced that it will pay a dividend of $0.40 per share on... |
3 Undervalued Dividend Stocks for Passive Income LoversHere are three undervalued dividend stocks all long-term investors may want to consider in this current environment. |
Gold Is Surging: 3 Gold Miners That Could Be Better than Buying BouillonHere are three top gold miners investors seeking portfolio diversification may want to consider in this uncertain environment. |
Here is What to Know Beyond Why Agnico Eagle Mines Limited (AEM) is a Trending StockAgnico (AEM) has received quite a bit of attention from Zacks.com users lately. Therefore, it is wise to be aware of the facts that can impact the stock's prospects. |
AEM Price Returns
1-mo | -10.08% |
3-mo | 12.01% |
6-mo | 3.98% |
1-year | -2.41% |
3-year | -14.35% |
5-year | 23.96% |
YTD | -1.02% |
2022 | 1.08% |
2021 | -23.64% |
2020 | 16.18% |
2019 | 54.18% |
2018 | -11.51% |
AEM Dividends
Ex-Dividend Date | Type | Payout Amount | Change | ||||||
---|---|---|---|---|---|---|---|---|---|
Loading, please wait... |
Continue Researching AEM
Want to see what other sources are saying about Agnico Eagle Mines Ltd's financials and stock price? Try the links below:Agnico Eagle Mines Ltd (AEM) Stock Price | Nasdaq
Agnico Eagle Mines Ltd (AEM) Stock Quote, History and News - Yahoo Finance
Agnico Eagle Mines Ltd (AEM) Stock Price and Basic Information | MarketWatch
Loading social stream, please wait...