American Electric Power Co. Inc. (AEP): Price and Financial Metrics
AEP Price/Volume Stats
Current price | $75.86 | 52-week high | $100.32 |
Prev. close | $76.34 | 52-week low | $74.88 |
Day low | $74.88 | Volume | 3,455,690 |
Day high | $76.52 | Avg. volume | 2,908,995 |
50-day MA | $80.67 | Dividend yield | 4.19% |
200-day MA | $87.81 | Market Cap | 39.08B |
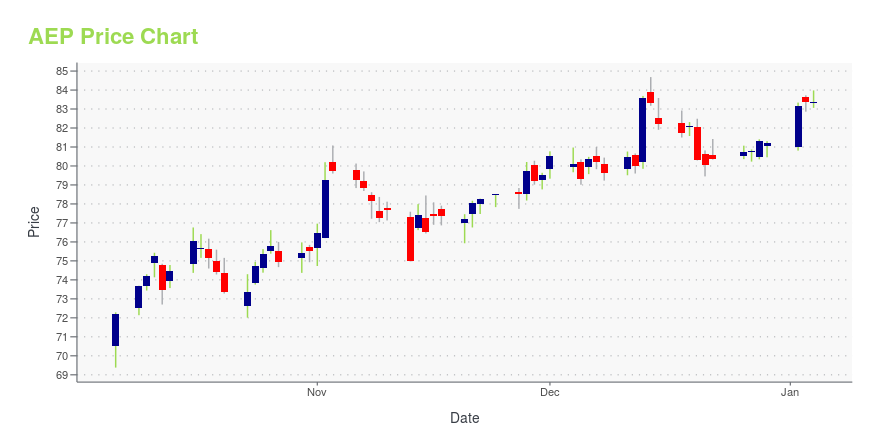
AEP Stock Price Chart Interactive Chart >
AEP POWR Grades
- AEP scores best on the Stability dimension, with a Stability rank ahead of 68.99% of US stocks.
- AEP's strongest trending metric is Momentum; it's been moving down over the last 177 days.
- AEP's current lowest rank is in the Value metric (where it is better than 21.8% of US stocks).
AEP Stock Summary
- With a market capitalization of $40,786,487,403, AMERICAN ELECTRIC POWER CO INC has a greater market value than 94.45% of US stocks.
- Of note is the ratio of AMERICAN ELECTRIC POWER CO INC's sales and general administrative expense to its total operating expenses; just 0.26% of US stocks have a lower such ratio.
- For AEP, its debt to operating expenses ratio is greater than that reported by 94.43% of US equities we're observing.
- If you're looking for stocks that are quantitatively similar to AMERICAN ELECTRIC POWER CO INC, a group of peers worth examining would be EXC, D, SRE, PCG, and DTE.
- AEP's SEC filings can be seen here. And to visit AMERICAN ELECTRIC POWER CO INC's official web site, go to www.aep.com.
AEP Valuation Summary
- AEP's price/earnings ratio is 20.5; this is 4.06% higher than that of the median Utilities stock.
- Over the past 243 months, AEP's price/sales ratio has gone up 1.3.
Below are key valuation metrics over time for AEP.
Stock | Date | P/S | P/B | P/E | EV/EBIT |
---|---|---|---|---|---|
AEP | 2023-09-22 | 2.1 | 1.7 | 20.5 | 23.9 |
AEP | 2023-09-21 | 2.1 | 1.7 | 20.7 | 24.0 |
AEP | 2023-09-20 | 2.1 | 1.7 | 20.9 | 24.1 |
AEP | 2023-09-19 | 2.1 | 1.7 | 20.8 | 24.1 |
AEP | 2023-09-18 | 2.1 | 1.7 | 20.8 | 24.1 |
AEP | 2023-09-15 | 2.1 | 1.7 | 20.8 | 24.1 |
AEP Growth Metrics
- Its 5 year cash and equivalents growth rate is now at 854.74%.
- Its year over year net income to common stockholders growth rate is now at 15.26%.
- Its 4 year net income to common stockholders growth rate is now at 162.64%.

The table below shows AEP's growth in key financial areas (numbers in millions of US dollars).
Date | Revenue | Operating Cash Flow | Net Income to Common Stock |
---|---|---|---|
2022-12-31 | 19,639.5 | 5,288 | 2,307.2 |
2022-09-30 | 18,819.8 | 5,600.1 | 2,461.8 |
2022-06-30 | 17,916.7 | 5,786.7 | 2,574.1 |
2022-03-31 | 17,103.5 | 5,579.3 | 2,627.8 |
2021-12-31 | 16,792 | 3,839.9 | 2,488.1 |
2021-09-30 | 16,341.2 | 3,883.7 | 2,384.7 |
AEP's Quality Factors
The “Quality” component of the POWR Ratings focuses on 31 different factors of a companies fundamentals and operational strength. Here are some key insights as we drill into the specifics of these quality attributes.- AEP has a Quality Grade of C, ranking ahead of 35.33% of graded US stocks.
- AEP's asset turnover comes in at 0.195 -- ranking 65th of 105 Utilities stocks.
- ED, CMS, and ATO are the stocks whose asset turnover ratios are most correlated with AEP.
The table below shows AEP's key quality metrics over time.
Period | Asset Turnover | Gross Margin | ROIC |
---|---|---|---|
2021-09-30 | 0.195 | 0.373 | 0.034 |
2021-06-30 | 0.193 | 0.372 | 0.034 |
2021-03-31 | 0.193 | 0.372 | 0.034 |
2020-12-31 | 0.189 | 0.380 | 0.034 |
2020-09-30 | 0.192 | 0.369 | 0.031 |
2020-06-30 | 0.199 | 0.364 | 0.032 |
AEP Price Target
For more insight on analysts targets of AEP, see our AEP price target page. And for a list of of all stocks sorted by upside potential based on analyst target price, see our Top Price Target page.
Average Price Target | $97.74 | Average Broker Recommendation | 1.61 (Moderate Buy) |
American Electric Power Co. Inc. (AEP) Company Bio
American Electric Power (AEP), (railcar reporting mark: AEPX) is a major investor-owned electric utility in the United States, delivering electricity to more than five million customers in 11 states. (Source:Wikipedia)
Latest AEP News From Around the Web
Below are the latest news stories about AMERICAN ELECTRIC POWER CO INC that investors may wish to consider to help them evaluate AEP as an investment opportunity.
The 7 Best Utilities Stocks to Buy Now: September 2023Although a boring sector, the best utilities stocks may offer a confident profile amid an ambiguous market environment. |
AEP BOARD ELECTS SLOAT CHAIR, NAMES STODDARD BOARD MEMBERThe Board of Directors of American Electric Power (Nasdaq: AEP) has elected Julie Sloat chair of the Board, effective Oct. 2. Sloat is AEP's president and chief executive officer. In addition, Daniel G. "Dan" Stoddard, retired senior vice president, chief nuclear officer and president of Contracted Assets for Dominion Energy, has been elected to the Board. |
AEP COMPLETES SALE OF UNREGULATED RENEWABLES ASSETSAmerican Electric Power (Nasdaq: AEP) has completed the sale of its 1,365-megawatt (MW) unregulated, contracted renewables portfolio to IRG Acquisition Holdings, a partnership owned by Invenergy, CDPQ and funds managed by Blackstone Infrastructure, at an enterprise value of $1.5 billion including project debt. AEP nets approximately $1.2 billion in cash after taxes, transaction fees and other customary adjustments. |
New Tax-Credit Market Aims to Funnel Billions to Clean EnergyA government plan to let companies cut their taxes by financing clean-energy projects kicked off with a deal to help fund a $1.5 billion wind-energy transaction that officials hope will spur tens of billions of dollars in climate financing. The tax-credit plan is part of the climate legislation that became law one year ago. The first publicly announced deal, by Bank of America will be closely watched because it could enable a far bigger range of companies to buy the credits than under current programs. |
Duke Energy Dividend Stock AnalysisDuke Energy Corp. merged with Progress Energy in mid-2012 and is the largest electric power holding company in the U.S., serving more than 7 million customers in six states. |
AEP Price Returns
1-mo | -4.22% |
3-mo | -7.94% |
6-mo | -15.00% |
1-year | -15.15% |
3-year | 4.55% |
5-year | 26.91% |
YTD | -17.79% |
2022 | 10.38% |
2021 | 10.68% |
2020 | -9.01% |
2019 | 30.52% |
2018 | 5.38% |
AEP Dividends
Ex-Dividend Date | Type | Payout Amount | Change | ||||||
---|---|---|---|---|---|---|---|---|---|
Loading, please wait... |
Continue Researching AEP
Here are a few links from around the web to help you further your research on American Electric Power Co Inc's stock as an investment opportunity:American Electric Power Co Inc (AEP) Stock Price | Nasdaq
American Electric Power Co Inc (AEP) Stock Quote, History and News - Yahoo Finance
American Electric Power Co Inc (AEP) Stock Price and Basic Information | MarketWatch
Loading social stream, please wait...