Alamos Gold Inc. Class A Common Shares (AGI): Price and Financial Metrics
GET POWR RATINGS... FREE!
AGI POWR Grades
- Quality is the dimension where AGI ranks best; there it ranks ahead of 64.57% of US stocks.
- AGI's strongest trending metric is Quality; it's been moving down over the last 177 days.
- AGI ranks lowest in Value; there it ranks in the 22nd percentile.
AGI Stock Summary
- AGI's current price/earnings ratio is 163.47, which is higher than 97.21% of US stocks with positive earnings.
- Of note is the ratio of ALAMOS GOLD INC's sales and general administrative expense to its total operating expenses; just 11.31% of US stocks have a lower such ratio.
- For AGI, its debt to operating expenses ratio is greater than that reported by merely 0.51% of US equities we're observing.
- If you're looking for stocks that are quantitatively similar to ALAMOS GOLD INC, a group of peers worth examining would be ROVR, PCRX, DV, NABL, and MTCH.
- AGI's SEC filings can be seen here. And to visit ALAMOS GOLD INC's official web site, go to www.alamosgold.com.
AGI Valuation Summary
- AGI's price/sales ratio is 5.5; this is 175% higher than that of the median Basic Materials stock.
- AGI's EV/EBIT ratio has moved down 53.6 over the prior 170 months.
Below are key valuation metrics over time for AGI.
Stock | Date | P/S | P/B | P/E | EV/EBIT |
---|---|---|---|---|---|
AGI | 2023-01-31 | 5.5 | 1.6 | 166.6 | 43.0 |
AGI | 2023-01-30 | 5.5 | 1.6 | 166.3 | 42.9 |
AGI | 2023-01-27 | 5.6 | 1.7 | 170.7 | 44.1 |
AGI | 2023-01-26 | 5.7 | 1.7 | 172.8 | 44.6 |
AGI | 2023-01-25 | 5.7 | 1.7 | 174.9 | 45.2 |
AGI | 2023-01-24 | 5.6 | 1.7 | 171.6 | 44.3 |
AGI Growth Metrics
- Its 5 year net cashflow from operations growth rate is now at 108.03%.
- The year over year net cashflow from operations growth rate now stands at -26.13%.
- Its 5 year net income to common stockholders growth rate is now at 343.64%.

The table below shows AGI's growth in key financial areas (numbers in millions of US dollars).
Date | Revenue | Operating Cash Flow | Net Income to Common Stock |
---|---|---|---|
2022-09-30 | 792.4 | 284.3 | 26 |
2022-06-30 | 776.8 | 292.7 | 52.5 |
2022-03-31 | 780.7 | 303.7 | -126.4 |
2021-12-31 | 823.6 | 356.5 | -66.7 |
2021-12-31 | 823.6 | 356.5 | -66.7 |
2021-09-30 | 847.1 | 399.8 | -19.3 |
AGI's Quality Factors
The “Quality” component of the POWR Ratings focuses on 31 different factors of a companies fundamentals and operational strength. Here are some key insights as we drill into the specifics of these quality attributes.- AGI has a Quality Grade of C, ranking ahead of 58.01% of graded US stocks.
- AGI's asset turnover comes in at 0.213 -- ranking 26th of 47 Precious Metals stocks.
- 500 - Internal server error
The table below shows AGI's key quality metrics over time.
Period | Asset Turnover | Gross Margin | ROIC |
---|---|---|---|
2020-12-31 | 0.213 | 0.356 | 0.070 |
2019-12-31 | 0.205 | 0.237 | 0.044 |
2018-12-31 | 0.198 | 0.019 | -0.012 |
2017-12-31 | 0.187 | 0.158 | 0.011 |
2016-12-31 | 0.195 | 0.110 | 0.007 |
2015-12-31 | 0.213 | -0.081 | -0.370 |
AGI Price Target
For more insight on analysts targets of AGI, see our AGI price target page. And for a list of of all stocks sorted by upside potential based on analyst target price, see our Top Price Target page.
Average Price Target | $10.38 | Average Broker Recommendation | 1.71 (Moderate Buy) |
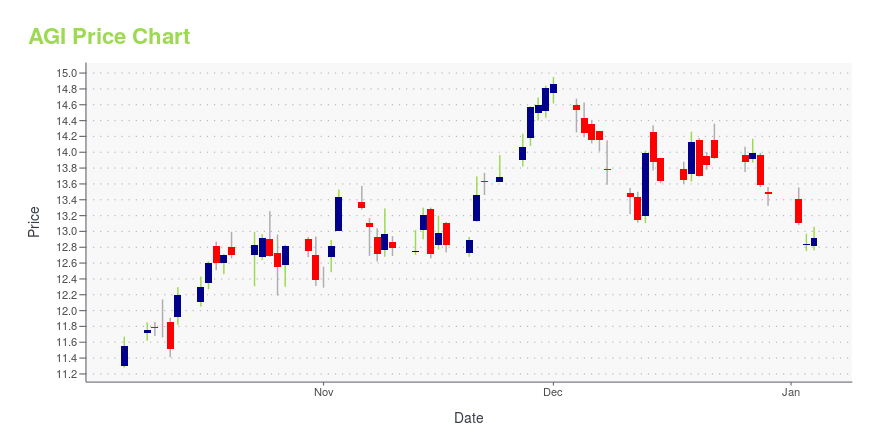
AGI Stock Price Chart Interactive Chart >
AGI Price/Volume Stats
Current price | $10.65 | 52-week high | $11.61 |
Prev. close | $10.83 | 52-week low | $6.35 |
Day low | $10.50 | Volume | 3,881,700 |
Day high | $10.76 | Avg. volume | 3,707,587 |
50-day MA | $10.36 | Dividend yield | 0.94% |
200-day MA | $8.29 | Market Cap | 4.19B |
Alamos Gold Inc. Class A Common Shares (AGI) Company Bio
Alamos Gold Inc. is a Canadian-based intermediate gold producer with diversified production from three operating mines in North America. The company was founded in 2003 and is based in Toronto, Canada.
Latest AGI News From Around the Web
Below are the latest news stories about ALAMOS GOLD INC that investors may wish to consider to help them evaluate AGI as an investment opportunity.
Alamos Gold Reports One of the Best Holes Drilled to Date at Puerto Del Aire (33.40 g/t Au (11.48 g/t cut) over 25.95 m true width), Further Extending High-Grade Gold Mineralization Beyond Mineral Reserves and ResourcesFigure 1_Puerto Del Aire Location Map, Mulatos District Figure 1_Puerto Del Aire Location Map, Mulatos District Figure 2_ Puerto Del Aire Sulphide Gold Mineralization Wireframes Figure 2_ Puerto Del Aire Sulphide Gold Mineralization Wireframes Figure 3 _ Puerto Del Aire, PDA1 and PDA2 New Drilling Results Figure 3 _ Puerto Del Aire, PDA1 and PDA2 New Drilling Results Figure 4 _ Puerto Del Aire, PDA1 and PDA2 Cross Section Through Long-Axis of Mineralization with New Drilling Results Figure 4 _ P |
AUY vs. AGI: Which Stock Should Value Investors Buy Now?AUY vs. AGI: Which Stock Is the Better Value Option? |
Top Gold StocksTop gold stocks include Lundin Gold, Perseus Mining, and Alamos Gold, which lead the industry in stock performance even as the Russell 1000 has fallen in the past year. |
Alamos Gold Provides Notice of Fourth Quarter and Year-End 2022 Results and Conference CallTORONTO, Jan. 19, 2023 (GLOBE NEWSWIRE) -- Alamos Gold Inc. (TSX:AGI; NYSE:AGI) (“Alamos” or the “Company”) plans to release its fourth quarter and year-end 2022 financial results after market close on Wednesday, February 22, 2023. Senior management will host a conference call on Thursday, February 23, 2023 at 11:00 am ET to discuss the results. Participants may join the conference call via webcast or through the following dial-in numbers: Toronto and International: (416) 340-2217Toll free (Cana |
Alamos Gold Reports Record Fourth Quarter 2022 Production and Provides Three-Year Production and Operating GuidanceStrong outlook with multi-year production guidance increased, capital guidance maintained, and all-in sustaining costs expected to decrease 18% over the next three years driving strong margin expansion Figure 1: 2023 - 2025 Production and AISC Guidance Figure 1: 2023 - 2025 Production and AISC Guidance TORONTO, Jan. 12, 2023 (GLOBE NEWSWIRE) -- Alamos Gold Inc. (TSX:AGI; NYSE:AGI) (“Alamos” or the “Company”) today reported fourth quarter and annual 2022 production. The Company also provided upda |
AGI Price Returns
1-mo | -1.93% |
3-mo | 26.50% |
6-mo | 32.58% |
1-year | 62.64% |
3-year | 79.88% |
5-year | 106.54% |
YTD | 5.34% |
2022 | 33.11% |
2021 | -11.28% |
2020 | 46.75% |
2019 | 68.43% |
2018 | -44.49% |
AGI Dividends
Ex-Dividend Date | Type | Payout Amount | Change | ||||||
---|---|---|---|---|---|---|---|---|---|
Loading, please wait... |
Continue Researching AGI
Here are a few links from around the web to help you further your research on Alamos Gold Inc's stock as an investment opportunity:Alamos Gold Inc (AGI) Stock Price | Nasdaq
Alamos Gold Inc (AGI) Stock Quote, History and News - Yahoo Finance
Alamos Gold Inc (AGI) Stock Price and Basic Information | MarketWatch
Loading social stream, please wait...