
Federal Agricultural Mortgage Corporation (AGM): Price and Financial Metrics
AGM Price/Volume Stats
| Current price | $215.18 | 52-week high | $217.60 |
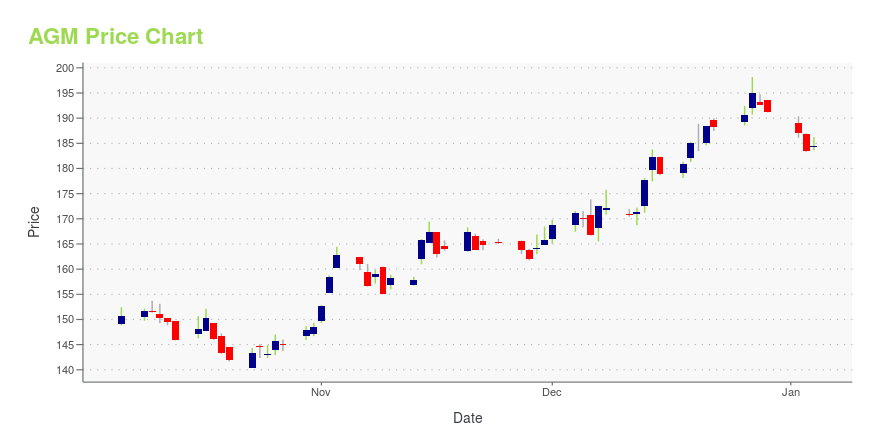
| Prev. close | $212.69 | 52-week low | $140.44 |
| Day low | $212.54 | Volume | 49,245 |
| Day high | $216.41 | Avg. volume | 58,617 |
| 50-day MA | $184.68 | Dividend yield | 2.61% |
| 200-day MA | $179.23 | Market Cap | 2.34B |
AGM Stock Price Chart Interactive Chart >
Federal Agricultural Mortgage Corporation (AGM) Company Bio
Federal Agricultural Mortgage Corporation provides a secondary market for various loans made to borrowers in the United States. It operates through four segments: Farm & Ranch, USDA Guarantees, Rural Utilities, and Institutional Credit. The company was founded in 1987 and is based in Washington, District of Columbia.
Latest AGM News From Around the Web
Below are the latest news stories about FEDERAL AGRICULTURAL MORTGAGE CORP that investors may wish to consider to help them evaluate AGM as an investment opportunity.
Zacks Industry Outlook Highlights Federal Agricultural Mortgage, LendingTree and Ocwen FinancialFederal Agricultural Mortgage, LendingTree and Ocwen Financial have been highlighted in this Industry Outlook article. |
Federal Agricultural Mortgage Corporation (NYSE:AGM) Might Not Be As Mispriced As It LooksWhen close to half the companies in the United States have price-to-earnings ratios (or "P/E's") above 17x, you may... |
Is American Equity Investment Life Holding (AEL) Stock Outpacing Its Finance Peers This Year?Here is how American Equity Investment (AEL) and Federal Agricultural Mortgage (AGM) have performed compared to their sector so far this year. |
7 Recession-Proof Dividend Stocks to Snap Up Before They SoarSnapping up these recession-proof dividend stocks is a great way to realize juicy total returns over a multi-year timeframe. |
Synchrony (SYF) to Issue Co-Branded Card for J.Crew ClientsSynchrony (SYF) ties up with J.Crew Group and Mastercard to introduce a consumer financing program and offer higher rewards for J.Crew customers. |
AGM Price Returns
| 1-mo | 21.43% |
| 3-mo | 13.56% |
| 6-mo | 15.51% |
| 1-year | 39.57% |
| 3-year | 143.80% |
| 5-year | 239.70% |
| YTD | 14.27% |
| 2023 | 74.61% |
| 2022 | -5.83% |
| 2021 | 72.62% |
| 2020 | -6.60% |
| 2019 | 43.16% |
AGM Dividends
| Ex-Dividend Date | Type | Payout Amount | Change | ||||||
|---|---|---|---|---|---|---|---|---|---|
| Loading, please wait... | |||||||||
Continue Researching AGM
Here are a few links from around the web to help you further your research on Federal Agricultural Mortgage Corp's stock as an investment opportunity:Federal Agricultural Mortgage Corp (AGM) Stock Price | Nasdaq
Federal Agricultural Mortgage Corp (AGM) Stock Quote, History and News - Yahoo Finance
Federal Agricultural Mortgage Corp (AGM) Stock Price and Basic Information | MarketWatch
Loading social stream, please wait...