
AGNC Investment Corp. (AGNC): Price and Financial Metrics
AGNC Price/Volume Stats
| Current price | $9.18 | 52-week high | $10.85 |
| Prev. close | $9.08 | 52-week low | $7.85 |
| Day low | $9.08 | Volume | 13,987,200 |
| Day high | $9.21 | Avg. volume | 27,181,184 |
| 50-day MA | $9.22 | Dividend yield | 15.86% |
| 200-day MA | $9.76 | Market Cap | 9.37B |
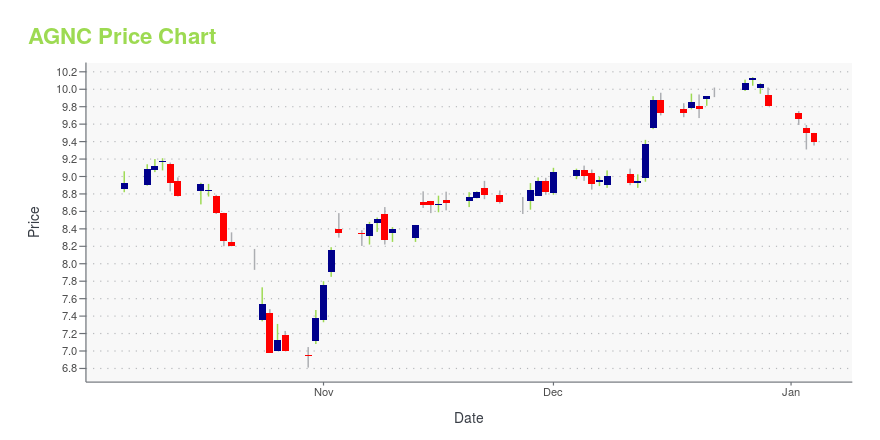
AGNC Stock Price Chart Interactive Chart >
AGNC Investment Corp. (AGNC) Company Bio
American Capital Agency originates, underwrites and manages investments in middle market private equity, leveraged finance, real estate, energy & infrastructure and structured products. The company was founded in 2008 and is based in Bethesda, Maryland.
AGNC Price Returns
| 1-mo | N/A |
| 3-mo | N/A |
| 6-mo | 2.33% |
| 1-year | 7.49% |
| 3-year | 21.68% |
| 5-year | 33.10% |
| YTD | 4.74% |
| 2024 | 8.89% |
| 2023 | 10.14% |
| 2022 | -21.66% |
| 2021 | 5.20% |
| 2020 | -1.78% |
AGNC Dividends
| Ex-Dividend Date | Type | Payout Amount | Change | ||||||
|---|---|---|---|---|---|---|---|---|---|
| Loading, please wait... | |||||||||
Continue Researching AGNC
Want to see what other sources are saying about AGNC Investment Corp's financials and stock price? Try the links below:AGNC Investment Corp (AGNC) Stock Price | Nasdaq
AGNC Investment Corp (AGNC) Stock Quote, History and News - Yahoo Finance
AGNC Investment Corp (AGNC) Stock Price and Basic Information | MarketWatch
Loading social stream, please wait...