AGNC Investment Corp. (AGNC): Price and Financial Metrics
GET POWR RATINGS... FREE!
AGNC POWR Grades
- AGNC scores best on the Momentum dimension, with a Momentum rank ahead of 84.89% of US stocks.
- AGNC's strongest trending metric is Momentum; it's been moving up over the last 179 days.
- AGNC's current lowest rank is in the Growth metric (where it is better than 0.43% of US stocks).
AGNC Stock Summary
- The ratio of debt to operating expenses for AGNC Investment Corp is higher than it is for about 99.95% of US stocks.
- As for revenue growth, note that AGNC's revenue has grown -583.81% over the past 12 months; that beats the revenue growth of only 0.07% of US companies in our set.
- AGNC Investment Corp's shareholder yield -- a measure of how much capital is returned to stockholders via dividends and buybacks -- is 87.2%, greater than the shareholder yield of 98.04% of stocks in our set.
- Stocks with similar financial metrics, market capitalization, and price volatility to AGNC Investment Corp are ORC, FNMA, EARN, FMCC, and NLY.
- Visit AGNC's SEC page to see the company's official filings. To visit the company's web site, go to www.agnc.com.
AGNC Valuation Summary
- In comparison to the median Real Estate stock, AGNC's price/earnings ratio is 88.02% lower, now standing at 4.5.
- AGNC's EV/EBIT ratio has moved NA NA over the prior 160 months.
- AGNC's price/sales ratio has moved NA NA over the prior 160 months.
Below are key valuation metrics over time for AGNC.
Stock | Date | P/S | P/B | P/E | EV/EBIT |
---|---|---|---|---|---|
AGNC | 2021-09-02 | 4.1 | 0.8 | 4.5 | 31.8 |
AGNC | 2021-09-01 | 4.1 | 0.8 | 4.5 | 31.8 |
AGNC | 2021-08-31 | 4.1 | 0.8 | 4.5 | 31.8 |
AGNC | 2021-08-30 | 4.1 | 0.8 | 4.5 | 31.8 |
AGNC | 2021-08-27 | 4.1 | 0.8 | 4.6 | 31.8 |
AGNC | 2021-08-26 | 4.1 | 0.8 | 4.5 | 31.8 |
AGNC Growth Metrics
- Its year over year cash and equivalents growth rate is now at -45.64%.
- The 2 year cash and equivalents growth rate now stands at 140.57%.
- Its 5 year cash and equivalents growth rate is now at 16.89%.

The table below shows AGNC's growth in key financial areas (numbers in millions of US dollars).
Date | Revenue | Operating Cash Flow | Net Income to Common Stock |
---|---|---|---|
2021-12-31 | 837 | 1,540 | 649 |
2021-09-30 | 1,644 | 1,574 | 1,451 |
2021-06-30 | 2,093 | 1,742 | 1,901 |
2021-03-31 | 3,224 | 1,828 | 3,030 |
2020-12-31 | -173 | 1,747 | -362 |
2020-09-30 | -77 | 1,710 | -265 |
AGNC's Quality Factors
The “Quality” component of the POWR Ratings focuses on 31 different factors of a companies fundamentals and operational strength. Here are some key insights as we drill into the specifics of these quality attributes.- AGNC has a Quality Grade of B, ranking ahead of 84.77% of graded US stocks.
- AGNC's asset turnover comes in at 0.026 -- ranking 324th of 444 Trading stocks.
- NLY, NRZ, and SEB are the stocks whose asset turnover ratios are most correlated with AGNC.
The table below shows AGNC's key quality metrics over time.
Period | Asset Turnover | Gross Margin | ROIC |
---|---|---|---|
2021-06-30 | 0.026 | 1 | 0.015 |
2021-03-31 | 0.038 | 1 | 0.021 |
2020-12-31 | -0.002 | 1 | -0.001 |
2020-09-30 | -0.001 | 1 | 0.000 |
2020-06-30 | -0.007 | 1 | -0.004 |
2020-03-31 | -0.018 | 1 | -0.010 |
AGNC Price Target
For more insight on analysts targets of AGNC, see our AGNC price target page. And for a list of of all stocks sorted by upside potential based on analyst target price, see our Top Price Target page.
Average Price Target | $16.96 | Average Broker Recommendation | 1.57 (Moderate Buy) |
AGNC Stock Price Chart Interactive Chart >
AGNC Price/Volume Stats
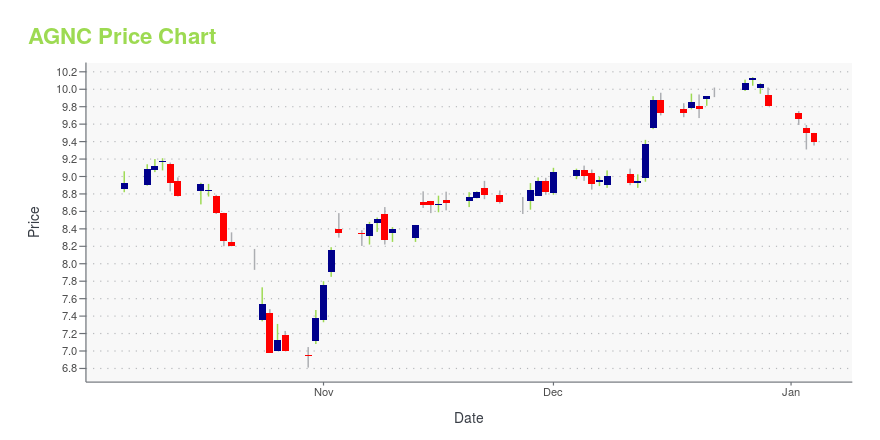
Current price | $12.16 | 52-week high | $18.84 |
Prev. close | $12.11 | 52-week low | $10.86 |
Day low | $11.94 | Volume | 4,206,002 |
Day high | $12.18 | Avg. volume | 10,888,832 |
50-day MA | $12.31 | Dividend yield | 11.89% |
200-day MA | $14.57 | Market Cap | 6.36B |
AGNC Investment Corp. (AGNC) Company Bio
American Capital Agency originates, underwrites and manages investments in middle market private equity, leveraged finance, real estate, energy & infrastructure and structured products. The company was founded in 2008 and is based in Bethesda, Maryland.
Latest AGNC News From Around the Web
Below are the latest news stories about AGNC Investment Corp that investors may wish to consider to help them evaluate AGNC as an investment opportunity.
3 Ultra-High-Yield Dividend Stocks Billionaires Can't Stop BuyingThese income stocks, with yields ranging from 8.8% to 13.4%, were scooped up by some of the world's brightest fund managers in the fourth quarter. |
Want $2,000 in Annual Dividend Income? Invest $16,250 Into This Ultra-High-Yield Stock TrioWhether you love chasing after the innovative capacity of growth stocks or prefer the simplicity of value stocks, either strategy can work wonders over the long run. Although it's a report I reference often, J.P. Morgan Asset Management's comparison of the performance of dividend-paying stocks to those not paying a dividend over multiple decades speaks wonders. J.P. Morgan Asset Management, a division of money-center bank JPMorgan Chase, found that dividend-paying companies returned an annual average of 9.5% between 1972 and 2012. |
5 Ultra-High-Yield Dividend Stocks That Can Help You Crush InflationThese supercharged income stocks, with yields ranging from 7.4% to 13.4%, can put rising costs in their place. |
Dynex And Annaly: Falling Book ValuesMortgage REIT management is hard. The business requires prediction of interest rates and spreads at multiple time points alongside the use of hedges to mitigate that risk. If that was not hard enough, the sector uses some of the highest amounts of leverage we can find anywhere in the market.... |
AGNC Investment. This Mortgage REIT Should Maintain Its 10% Dividend. Nice Yield Play.No summary available. |
AGNC Price Returns
1-mo | 11.96% |
3-mo | -3.79% |
6-mo | -18.63% |
1-year | -27.46% |
3-year | -0.90% |
5-year | 1.08% |
YTD | -15.24% |
2021 | 5.20% |
2020 | -1.78% |
2019 | 13.31% |
2018 | -2.46% |
2017 | 23.73% |
AGNC Dividends
Ex-Dividend Date | Type | Payout Amount | Change | ||||||
---|---|---|---|---|---|---|---|---|---|
Loading, please wait... |
Continue Researching AGNC
Want to see what other sources are saying about AGNC Investment Corp's financials and stock price? Try the links below:AGNC Investment Corp (AGNC) Stock Price | Nasdaq
AGNC Investment Corp (AGNC) Stock Quote, History and News - Yahoo Finance
AGNC Investment Corp (AGNC) Stock Price and Basic Information | MarketWatch
Loading social stream, please wait...