Align Technology Inc. (ALGN): Price and Financial Metrics
ALGN Price/Volume Stats
Current price | $301.68 | 52-week high | $413.20 |
Prev. close | $299.01 | 52-week low | $172.05 |
Day low | $297.12 | Volume | 744,151 |
Day high | $303.93 | Avg. volume | 828,091 |
50-day MA | $345.96 | Dividend yield | N/A |
200-day MA | $311.05 | Market Cap | 23.09B |
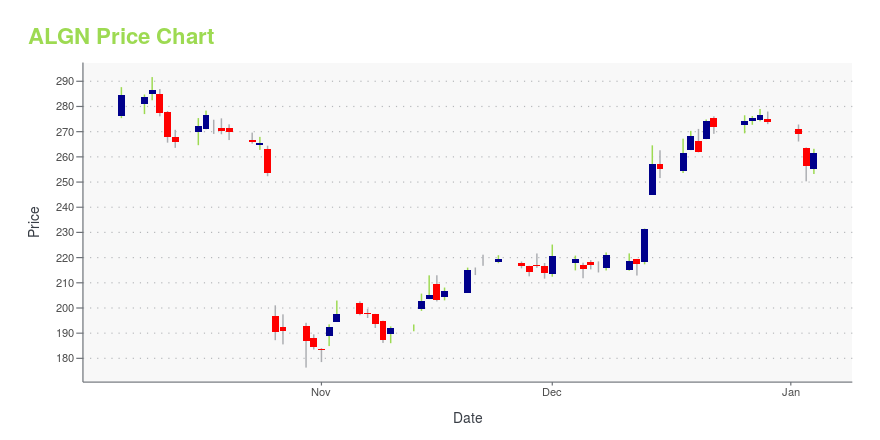
ALGN Stock Price Chart Interactive Chart >
ALGN POWR Grades
- ALGN scores best on the Quality dimension, with a Quality rank ahead of 96.26% of US stocks.
- ALGN's strongest trending metric is Growth; it's been moving up over the last 177 days.
- ALGN ranks lowest in Momentum; there it ranks in the 6th percentile.
ALGN Stock Summary
- ALGN has a higher market value than 91.17% of US stocks; more precisely, its current market capitalization is $22,849,902,666.
- With a price/earnings ratio of 72.75, ALIGN TECHNOLOGY INC P/E ratio is greater than that of about 92.63% of stocks in our set with positive earnings.
- For ALGN, its debt to operating expenses ratio is greater than that reported by just 10.12% of US equities we're observing.
- If you're looking for stocks that are quantitatively similar to ALIGN TECHNOLOGY INC, a group of peers worth examining would be WST, GGG, CSGP, FTV, and GMED.
- Visit ALGN's SEC page to see the company's official filings. To visit the company's web site, go to www.aligntech.com.
ALGN Valuation Summary
- In comparison to the median Healthcare stock, ALGN's price/earnings ratio is 172.66% higher, now standing at 72.8.
- ALGN's EV/EBIT ratio has moved up 53.6 over the prior 243 months.
Below are key valuation metrics over time for ALGN.
Stock | Date | P/S | P/B | P/E | EV/EBIT |
---|---|---|---|---|---|
ALGN | 2023-09-22 | 6.1 | 6.3 | 72.8 | 40.4 |
ALGN | 2023-09-21 | 6.1 | 6.3 | 73.2 | 40.7 |
ALGN | 2023-09-20 | 6.3 | 6.5 | 75.4 | 42.0 |
ALGN | 2023-09-19 | 6.5 | 6.7 | 77.5 | 43.2 |
ALGN | 2023-09-18 | 6.7 | 6.8 | 79.3 | 44.2 |
ALGN | 2023-09-15 | 6.8 | 7.0 | 80.9 | 45.1 |
ALGN Growth Metrics
- The 2 year revenue growth rate now stands at 67.35%.
- The 5 year net income to common stockholders growth rate now stands at 764.34%.
- The year over year net cashflow from operations growth rate now stands at 10.95%.

The table below shows ALGN's growth in key financial areas (numbers in millions of US dollars).
Date | Revenue | Operating Cash Flow | Net Income to Common Stock |
---|---|---|---|
2022-09-30 | 3,864.219 | 696.874 | 510.759 |
2022-06-30 | 3,989.777 | 785.396 | 619.028 |
2022-03-31 | 4,031.032 | 975.855 | 705.942 |
2021-12-31 | 3,952.584 | 1,172.544 | 772.02 |
2021-09-30 | 3,756.005 | 1,281.113 | 740.047 |
2021-06-30 | 3,474.243 | 1,137.181 | 698.449 |
ALGN's Quality Factors
The “Quality” component of the POWR Ratings focuses on 31 different factors of a companies fundamentals and operational strength. Here are some key insights as we drill into the specifics of these quality attributes.- ALGN has a Quality Grade of B, ranking ahead of 91.22% of graded US stocks.
- ALGN's asset turnover comes in at 0.705 -- ranking 51st of 186 Medical Equipment stocks.
- NUVA, XENT, and IART are the stocks whose asset turnover ratios are most correlated with ALGN.
The table below shows ALGN's key quality metrics over time.
Period | Asset Turnover | Gross Margin | ROIC |
---|---|---|---|
2021-06-30 | 0.705 | 0.743 | 0.442 |
2021-03-31 | 0.614 | 0.727 | 0.277 |
2020-12-31 | 0.574 | 0.713 | 0.175 |
2020-09-30 | 0.614 | 0.710 | 0.169 |
2020-06-30 | 0.673 | 0.707 | 0.167 |
2020-03-31 | 0.863 | 0.721 | 0.401 |
ALGN Price Target
For more insight on analysts targets of ALGN, see our ALGN price target page. And for a list of of all stocks sorted by upside potential based on analyst target price, see our Top Price Target page.
Average Price Target | $745.36 | Average Broker Recommendation | 1.43 (Moderate Buy) |
Align Technology Inc. (ALGN) Company Bio
Align Technology is a manufacturer of 3D digital scanners and the Invisalign clear aligners used in orthodontics. It is headquartered in Phoenix, Arizona; it manufactures the aligners in Juarez, Mexico and its scanners in Israel and China. (Source:Wikipedia)
Latest ALGN News From Around the Web
Below are the latest news stories about ALIGN TECHNOLOGY INC that investors may wish to consider to help them evaluate ALGN as an investment opportunity.
Unveiling the Investment Potential of Align Technology Inc (ALGN): A Comprehensive AnalysisDecoding the Financial Metrics and Competitive Strengths of Align Technology Inc (ALGN) |
Align (ALGN) Gains From Growing Invisalign Volume, InnovationAlign Technology (ALGN) is expanding its sales and marketing by reaching new countries and regions, including new areas within Africa and Latin America. |
Down -14.38% in 4 Weeks, Here's Why You Should You Buy the Dip in Align Technology (ALGN)Align Technology (ALGN) has become technically an oversold stock now, which implies exhaustion of the heavy selling pressure on it. This, combined with strong agreement among Wall Street analysts in revising earnings estimates higher, indicates a potential trend reversal for the stock in the near term. |
3 Nasdaq Stocks That Should Be on Every Investor’s Radar This FallThese three Nasdaq stocks are the best ones to buy in on for long-term growth given all of the innovative products being created. |
Unveiling the Investment Potential of Align Technology Inc (ALGN): A Comprehensive Analysis of ...Delving into the financial growth, competitive advantages, and market leadership of Align Technology Inc (ALGN) |
ALGN Price Returns
1-mo | -15.89% |
3-mo | -11.74% |
6-mo | -9.71% |
1-year | 40.83% |
3-year | -5.11% |
5-year | -22.89% |
YTD | 43.04% |
2022 | -67.91% |
2021 | 22.98% |
2020 | 91.51% |
2019 | 33.24% |
2018 | -5.74% |
Continue Researching ALGN
Want to see what other sources are saying about Align Technology Inc's financials and stock price? Try the links below:Align Technology Inc (ALGN) Stock Price | Nasdaq
Align Technology Inc (ALGN) Stock Quote, History and News - Yahoo Finance
Align Technology Inc (ALGN) Stock Price and Basic Information | MarketWatch
Loading social stream, please wait...