
Allstate Corp. (ALL): Price and Financial Metrics
ALL Price/Volume Stats
| Current price | $169.17 | 52-week high | $179.93 |
| Prev. close | $165.40 | 52-week low | $104.29 |
| Day low | $166.46 | Volume | 1,913,700 |
| Day high | $171.18 | Avg. volume | 1,571,887 |
| 50-day MA | $164.35 | Dividend yield | 2.12% |
| 200-day MA | $154.17 | Market Cap | 44.65B |
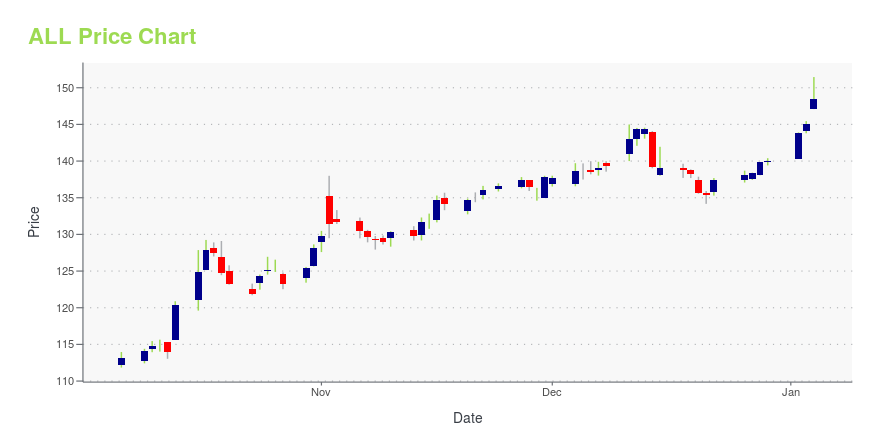
ALL Stock Price Chart Interactive Chart >
Allstate Corp. (ALL) Company Bio
The Allstate Corporation is an American insurance company, headquartered in Northfield Township, Illinois, near Northbrook since 1967.[4][5] Founded in 1931 as part of Sears, Roebuck and Co., it was spun off in 1993.[3] The company also has personal lines insurance operations in Canada. (Source:Wikipedia)
Latest ALL News From Around the Web
Below are the latest news stories about ALLSTATE CORP that investors may wish to consider to help them evaluate ALL as an investment opportunity.
15 Best Pet Insurance Companies Heading into 2024In this article, we will cover the 15 best pet insurance companies heading into 2024. If you want to skip our detailed analysis of the pet insurance market, you can go directly to 5 Best Pet Insurance Companies Heading into 2024. The Global Pet Insurance Market: An Analysis Driven by economic trends, increasing pet adoption, […] |
Allstate (ALL): Strong Industry, Solid Earnings Estimate RevisionsAllstate (ALL) has seen solid earnings estimate revision activity over the past month, and belongs to a strong industry as well. |
15 Best Auto Insurance Companies Heading into 2024In this article, we will look at the 15 best auto insurance companies heading into 2024. If you want to skip our detailed analysis of the auto insurance market, you can go directly to 5 Best Auto Insurance Companies Heading into 2024. Global Auto Insurance Industry Poised for Growth The auto insurance industry is a […] |
15 Best Long Term Care Insurance Companies Heading into 2024In this article, we will look into the 15 best long-term care insurance companies heading into 2024. If you want to skip our detailed analysis, you can go directly to the 5 Best Long Term Care Insurance Companies Heading into 2024. Market Analysis of Long-Term Care Insurance Long-term care insurance is provided to senior citizens […] |
15 Best Mortgage Insurance Companies Heading into 2024In this article, we will look into the 15 best mortgage insurance companies heading into 2024. If you want to skip our detailed analysis, you can go directly to the 5 Best Mortgage Insurance Companies Heading into 2024. Mortgage Insurance Market Shift According to an article by National Mortgage News, published on August 7, 2023, […] |
ALL Price Returns
| 1-mo | 6.83% |
| 3-mo | 0.03% |
| 6-mo | 8.04% |
| 1-year | 54.00% |
| 3-year | 39.55% |
| 5-year | 86.25% |
| YTD | 22.24% |
| 2023 | 6.37% |
| 2022 | 18.37% |
| 2021 | 9.86% |
| 2020 | -0.12% |
| 2019 | 38.82% |
ALL Dividends
| Ex-Dividend Date | Type | Payout Amount | Change | ||||||
|---|---|---|---|---|---|---|---|---|---|
| Loading, please wait... | |||||||||
Continue Researching ALL
Want to do more research on Allstate Corp's stock and its price? Try the links below:Allstate Corp (ALL) Stock Price | Nasdaq
Allstate Corp (ALL) Stock Quote, History and News - Yahoo Finance
Allstate Corp (ALL) Stock Price and Basic Information | MarketWatch
Loading social stream, please wait...