
Allegion PLC (ALLE): Price and Financial Metrics
ALLE Price/Volume Stats
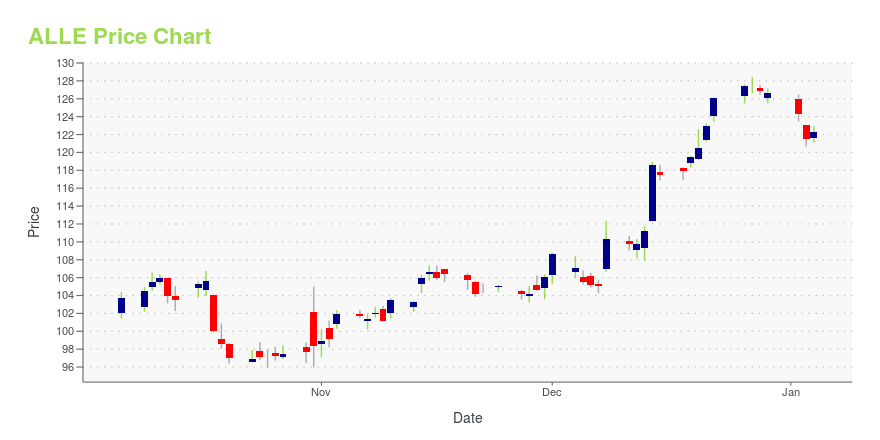
| Current price | $136.77 | 52-week high | $137.52 |
| Prev. close | $132.88 | 52-week low | $95.94 |
| Day low | $133.43 | Volume | 1,089,860 |
| Day high | $137.52 | Avg. volume | 705,297 |
| 50-day MA | $120.72 | Dividend yield | 1.51% |
| 200-day MA | $120.07 | Market Cap | 11.96B |
ALLE Stock Price Chart Interactive Chart >
Allegion PLC (ALLE) Company Bio
Allegion plc is an American Irish-domiciled provider of security products for homes and businesses. It comprises thirty-one global brands, including CISA, Interflex, LCN, Schlage and Von Duprin. The US$12 billion company sells products in more than 130 countries across the world. David D. Petratis was announced chairman of the board, chief executive officer and president of the company, in August 2013. As of 2022, John H. Stone became the president and chief executive officer of the company. Petratis remains the chairman of the board until Jan 2, 2023. (Source:Wikipedia)
Latest ALLE News From Around the Web
Below are the latest news stories about ALLEGION PLC that investors may wish to consider to help them evaluate ALLE as an investment opportunity.
Is Allegion plc (NYSE:ALLE) Expensive For A Reason? A Look At Its Intrinsic ValueKey Insights Using the 2 Stage Free Cash Flow to Equity, Allegion fair value estimate is US$105 Allegion's US$126 share... |
Allegion (ALLE) Gains From Business Strength Amid HeadwindsAllegion (ALLE) is likely to benefit from strength across its businesses, strong prolonged actions and acquired businesses. However, lower demand for residential products remains a concern. |
Allegion PLC's Dividend AnalysisAllegion PLC (NYSE:ALLE) recently announced a dividend of $0.45 per share, payable on 2023-12-29, with the ex-dividend date set for 2023-12-15. As investors look forward to this upcoming payment, the spotlight also shines on the company's dividend history, yield, and growth rates. Using the data from GuruFocus, let's look into Allegion PLC's dividend performance and assess its sustainability. |
Be Sure To Check Out Allegion plc (NYSE:ALLE) Before It Goes Ex-DividendRegular readers will know that we love our dividends at Simply Wall St, which is why it's exciting to see Allegion plc... |
Why Allegion Stock Zoomed 5% Higher TodayInvestors felt secure enough about security-products specialist Allegion (NYSE: ALLE) to push its share price up by 5% on Friday. This had little to do with the company directly; rather, a major acquisition in the security space was the main impetus for the price lift. It's always news when storied industrial conglomerate Honeywell International (NASDAQ: HON) makes a big-ticket buy. |
ALLE Price Returns
| 1-mo | 19.29% |
| 3-mo | 10.88% |
| 6-mo | 10.37% |
| 1-year | 20.28% |
| 3-year | 4.64% |
| 5-year | 39.02% |
| YTD | 8.78% |
| 2023 | 22.32% |
| 2022 | -19.26% |
| 2021 | 15.06% |
| 2020 | -5.41% |
| 2019 | 57.89% |
ALLE Dividends
| Ex-Dividend Date | Type | Payout Amount | Change | ||||||
|---|---|---|---|---|---|---|---|---|---|
| Loading, please wait... | |||||||||
Continue Researching ALLE
Here are a few links from around the web to help you further your research on Allegion plc's stock as an investment opportunity:Allegion plc (ALLE) Stock Price | Nasdaq
Allegion plc (ALLE) Stock Quote, History and News - Yahoo Finance
Allegion plc (ALLE) Stock Price and Basic Information | MarketWatch
Loading social stream, please wait...