Ally Financial Inc. (ALLY): Price and Financial Metrics
ALLY Price/Volume Stats
Current price | $39.81 | 52-week high | $41.56 |
Prev. close | $39.18 | 52-week low | $22.54 |
Day low | $39.38 | Volume | 2,218,200 |
Day high | $39.83 | Avg. volume | 4,062,592 |
50-day MA | $36.91 | Dividend yield | 3.05% |
200-day MA | $30.45 | Market Cap | 12.01B |
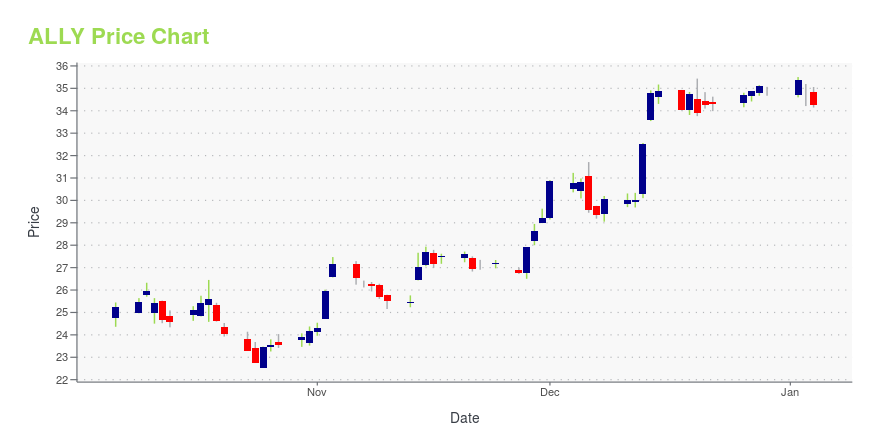
ALLY Stock Price Chart Interactive Chart >
ALLY POWR Grades
- Momentum is the dimension where ALLY ranks best; there it ranks ahead of 93.11% of US stocks.
- ALLY's strongest trending metric is Quality; it's been moving down over the last 26 weeks.
- ALLY's current lowest rank is in the Growth metric (where it is better than 5.49% of US stocks).
ALLY Stock Summary
- The price/operating cash flow metric for ALLY FINANCIAL INC is higher than only 5.11% of stocks in our set with a positive cash flow.
- Equity multiplier, or assets relative to shareholders' equity, comes in at 14.85 for ALLY FINANCIAL INC; that's greater than it is for 96.18% of US stocks.
- ALLY FINANCIAL INC's shareholder yield -- a measure of how much capital is returned to stockholders via dividends and buybacks -- is 17.61%, greater than the shareholder yield of 90.44% of stocks in our set.
- If you're looking for stocks that are quantitatively similar to ALLY FINANCIAL INC, a group of peers worth examining would be CCB, SLM, AFG, FFWM, and SYF.
- Visit ALLY's SEC page to see the company's official filings. To visit the company's web site, go to www.ally.com.
ALLY Valuation Summary
- ALLY's price/sales ratio is 1.2; this is 0% higher than that of the median Financial Services stock.
- ALLY's price/sales ratio has moved down 2.6 over the prior 120 months.
Below are key valuation metrics over time for ALLY.
Stock | Date | P/S | P/B | P/E | EV/EBIT |
---|---|---|---|---|---|
ALLY | 2023-12-22 | 1.2 | 0.8 | 9.3 | 18.0 |
ALLY | 2023-12-21 | 1.2 | 0.8 | 9.3 | 18.0 |
ALLY | 2023-12-20 | 1.2 | 0.8 | 9.2 | 17.9 |
ALLY | 2023-12-19 | 1.3 | 0.8 | 9.4 | 18.1 |
ALLY | 2023-12-18 | 1.2 | 0.8 | 9.2 | 17.9 |
ALLY | 2023-12-15 | 1.3 | 0.8 | 9.5 | 18.1 |
ALLY Growth Metrics
- Its 3 year net income to common stockholders growth rate is now at 104.33%.
- Its 5 year cash and equivalents growth rate is now at 43.21%.
- Its 4 year revenue growth rate is now at 13.18%.
The table below shows ALLY's growth in key financial areas (numbers in millions of US dollars).
Date | Revenue | Operating Cash Flow | Net Income to Common Stock |
---|---|---|---|
2022-12-31 | 8,428 | 6,247 | 1,604 |
2022-09-30 | 8,426 | 6,033 | 1,977 |
2022-06-30 | 8,395 | 5,892 | 2,388 |
2022-03-31 | 8,404 | 4,513 | 2,834 |
2021-12-31 | 8,206 | 4,042 | 3,003 |
2021-09-30 | 7,988 | 4,218 | 3,066 |
ALLY's Quality Factors
The “Quality” component of the POWR Ratings focuses on 31 different factors of a companies fundamentals and operational strength. Here are some key insights as we drill into the specifics of these quality attributes.- ALLY has a Quality Grade of C, ranking ahead of 46.66% of graded US stocks.
- ALLY's asset turnover comes in at 0.042 -- ranking 147th of 430 Banking stocks.
- HWBK, PDLB, and CBAN are the stocks whose asset turnover ratios are most correlated with ALLY.
The table below shows ALLY's key quality metrics over time.
Period | Asset Turnover | Gross Margin | ROIC |
---|---|---|---|
2021-06-30 | 0.042 | 0.963 | 0.019 |
2021-03-31 | 0.039 | 0.951 | 0.015 |
2020-12-31 | 0.036 | 0.946 | 0.007 |
2020-09-30 | 0.035 | 0.943 | 0.005 |
2020-06-30 | 0.034 | 0.944 | 0.004 |
2020-03-31 | 0.034 | 0.946 | 0.005 |
Ally Financial Inc. (ALLY) Company Bio
Ally Financial is a bank holding company organized in Delaware and headquartered in Detroit, Michigan. The company provides financial services including car finance, online banking via a direct bank, corporate lending, vehicle insurance, mortgage loans, and an electronic trading platform to trade financial assets. (Source:Wikipedia)
Latest ALLY News From Around the Web
Below are the latest news stories about ALLY FINANCIAL INC that investors may wish to consider to help them evaluate ALLY as an investment opportunity.
The 7 Highest-Yielding Dividend Gems in Warren Buffet’s CrownWarren Buffett doesn’t hide the fact he loves dividends. |
Bank Stocks Are Soaring After the Latest Interest Rate News. This Buffett Stock Is Beating Them All, and It Might Surprise You.If you understand why Buffett bought this stock, its rally makes a lot of sense. |
4 Things You Need to Know if You Buy Ally Financial Stock TodayAlly Financial stock could benefit from a Federal Reserve pivot, but there are a few things investors will want to consider first. |
Ally Financial schedules release of fourth quarter and full year 2023 financial resultsAlly Financial Inc. (NYSE: ALLY) has scheduled the release of its fourth quarter and full year 2023 financial results for Friday, January 19, 2024, at approximately 7:30 a.m. ET. The results will be available on the Ally Press Room website (http://media.ally.com). |
14 Best Bank Dividend Stocks To Buy NowIn this article, we discuss 14 best bank dividend stocks to buy now. You can skip our detailed analysis of the banking sector and the performance of bank stocks, and go directly to read 5 Best Bank Dividend Stocks To Buy Now. During most of the 2022 market decline, financial stocks were seen as a […] |
ALLY Price Returns
1-mo | 8.77% |
3-mo | 14.92% |
6-mo | 52.33% |
1-year | 66.52% |
3-year | -1.78% |
5-year | 68.77% |
YTD | 14.92% |
2023 | 49.22% |
2022 | -46.89% |
2021 | 36.04% |
2020 | 20.56% |
2019 | 37.94% |
ALLY Dividends
Ex-Dividend Date | Type | Payout Amount | Change | ||||||
---|---|---|---|---|---|---|---|---|---|
Loading, please wait... |
Continue Researching ALLY
Want to see what other sources are saying about Ally Financial Inc's financials and stock price? Try the links below:Ally Financial Inc (ALLY) Stock Price | Nasdaq
Ally Financial Inc (ALLY) Stock Quote, History and News - Yahoo Finance
Ally Financial Inc (ALLY) Stock Price and Basic Information | MarketWatch
Loading social stream, please wait...