Ally Financial Inc. (ALLY): Price and Financial Metrics
GET POWR RATINGS... FREE!
ALLY POWR Grades
- ALLY scores best on the Value dimension, with a Value rank ahead of 72.8% of US stocks.
- ALLY's strongest trending metric is Growth; it's been moving down over the last 177 days.
- ALLY's current lowest rank is in the Growth metric (where it is better than 8.83% of US stocks).
ALLY Stock Summary
- Price to trailing twelve month operating cash flow for ALLY is currently 1.74, higher than just 6.14% of US stocks with positive operating cash flow.
- Equity multiplier, or assets relative to shareholders' equity, comes in at 12.58 for ALLY FINANCIAL INC; that's greater than it is for 95.14% of US stocks.
- Shareholder yield, a measure of how much is returned to shareholders via dividends and share repurchases, for ALLY comes in at -53.87% -- higher than that of merely 9.37% of stocks in our set.
- Stocks that are quantitatively similar to ALLY, based on their financial statements, market capitalization, and price volatility, are SYF, AEL, ATLC, UNM, and BBD.
- Visit ALLY's SEC page to see the company's official filings. To visit the company's web site, go to www.ally.com.
ALLY Valuation Summary
- ALLY's price/sales ratio is 1.1; this is 8.33% lower than that of the median Financial Services stock.
- Over the past 109 months, ALLY's EV/EBIT ratio has gone down 474.9.
Below are key valuation metrics over time for ALLY.
Stock | Date | P/S | P/B | P/E | EV/EBIT |
---|---|---|---|---|---|
ALLY | 2023-01-23 | 1.1 | 0.8 | 4.9 | 10.6 |
ALLY | 2023-01-20 | 1.1 | 0.8 | 4.7 | 10.5 |
ALLY | 2023-01-19 | 0.9 | 0.6 | 4.0 | 9.9 |
ALLY | 2023-01-18 | 1.0 | 0.6 | 4.1 | 10.0 |
ALLY | 2023-01-17 | 1.0 | 0.6 | 4.1 | 10.0 |
ALLY | 2023-01-13 | 1.0 | 0.6 | 4.1 | 10.0 |
ALLY Growth Metrics
- Its 5 year net income to common stockholders growth rate is now at -0.87%.
- Its 4 year net income to common stockholders growth rate is now at -0.87%.
- Its 5 year revenue growth rate is now at 13.18%.

The table below shows ALLY's growth in key financial areas (numbers in millions of US dollars).
Date | Revenue | Operating Cash Flow | Net Income to Common Stock |
---|---|---|---|
2022-09-30 | 8,426 | 6,033 | 1,977 |
2022-06-30 | 8,395 | 5,892 | 2,388 |
2022-03-31 | 8,404 | 4,513 | 2,834 |
2021-12-31 | 8,206 | 4,042 | 3,003 |
2021-09-30 | 7,988 | 4,218 | 3,066 |
2021-06-30 | 7,687 | 4,199 | 2,859 |
ALLY's Quality Factors
The “Quality” component of the POWR Ratings focuses on 31 different factors of a companies fundamentals and operational strength. Here are some key insights as we drill into the specifics of these quality attributes.- ALLY has a Quality Grade of C, ranking ahead of 46.66% of graded US stocks.
- ALLY's asset turnover comes in at 0.042 -- ranking 147th of 430 Banking stocks.
- HWBK, PDLB, and CBAN are the stocks whose asset turnover ratios are most correlated with ALLY.
The table below shows ALLY's key quality metrics over time.
Period | Asset Turnover | Gross Margin | ROIC |
---|---|---|---|
2021-06-30 | 0.042 | 0.963 | 0.019 |
2021-03-31 | 0.039 | 0.951 | 0.015 |
2020-12-31 | 0.036 | 0.946 | 0.007 |
2020-09-30 | 0.035 | 0.943 | 0.005 |
2020-06-30 | 0.034 | 0.944 | 0.004 |
2020-03-31 | 0.034 | 0.946 | 0.005 |
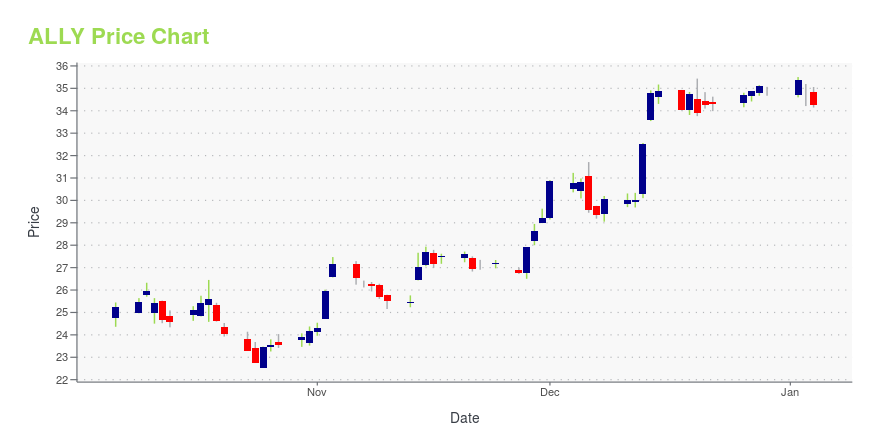
ALLY Stock Price Chart Interactive Chart >
ALLY Price/Volume Stats
Current price | $34.76 | 52-week high | $51.05 |
Prev. close | $35.20 | 52-week low | $22.34 |
Day low | $33.98 | Volume | 4,617,700 |
Day high | $35.24 | Avg. volume | 7,910,961 |
50-day MA | $27.06 | Dividend yield | 3.45% |
200-day MA | $32.18 | Market Cap | 10.38B |
Ally Financial Inc. (ALLY) Company Bio
Ally Financial is a bank holding company organized in Delaware and headquartered in Detroit, Michigan. The company provides financial services including car finance, online banking via a direct bank, corporate lending, vehicle insurance, mortgage loans, and an electronic trading platform to trade financial assets. (Source:Wikipedia)
Latest ALLY News From Around the Web
Below are the latest news stories about ALLY FINANCIAL INC that investors may wish to consider to help them evaluate ALLY as an investment opportunity.
Why Ally Financial Stock Gained 32.9% in JanuaryAlly Financial (NYSE: ALLY) had an excellent month as its stock price surged 32.9% in January, according to S&P Global Market Intelligence. The stock price is currently up about 43% year to date after a difficult 2022 when it fell almost 47%. Ally Financial, the online bank and leading auto lender, saw its stock price surge after the release of its fourth-quarter earnings. |
The 22 Fund Announces Multi-Million Dollar Investments from Ally Financial and 4S Bay to Create Sustainable High-Tech U.S. Manufacturing JobsThe 22 Fund (The 22), a Los Angeles-based impact, early-growth venture fund, today announced multi-million dollar investments from Ally Financial Inc. (Ally) and family office 4S Bay to support The 22's mission to address needs of diverse entrepreneurs often overlooked by traditional investors. Ally committed up to $10 million in equity investment. 4S Bay committed $1.5 million. |
Banks Brace for More Consumers to Fall Behind on Their LoansDelinquencies are rising, in some cases surpassing prepandemic levels, prompting banks to add to their rainy-day funds. |
How Much Income Can You Make Investing $10,000 in Warren Buffett's Top 5 Dividend Stocks?If you're Warren Buffett, you won't have to use your imagination. Here's how much income you could make investing $10,000 in each of Buffett's top five dividend stocks. Let me first define how I identified Buffett's top five dividend stocks. |
3 Stocks Up 25% or More in 2023 That Are Still Worth BuyingThe stock market is off to a decent start in 2023, with the S&P 500 up by about 4% with about a week left in January -- not a stellar performance but a welcome change from last year. Block (NYSE: SQ), formerly known as Square, dramatically underperformed the market in 2022, for a few reasons. There are also credit risk fears surrounding the (expensive) Afterpay acquisition, as well as the cooling off in Bitcoin prices, both significant revenue drivers for Cash App. |
ALLY Price Returns
1-mo | 34.61% |
3-mo | 35.91% |
6-mo | 7.61% |
1-year | -25.76% |
3-year | 16.40% |
5-year | 40.82% |
YTD | 43.53% |
2022 | -46.89% |
2021 | 36.04% |
2020 | 20.56% |
2019 | 37.94% |
2018 | -20.67% |
ALLY Dividends
Ex-Dividend Date | Type | Payout Amount | Change | ||||||
---|---|---|---|---|---|---|---|---|---|
Loading, please wait... |
Continue Researching ALLY
Want to see what other sources are saying about Ally Financial Inc's financials and stock price? Try the links below:Ally Financial Inc (ALLY) Stock Price | Nasdaq
Ally Financial Inc (ALLY) Stock Quote, History and News - Yahoo Finance
Ally Financial Inc (ALLY) Stock Price and Basic Information | MarketWatch
Loading social stream, please wait...