AMETEK Inc. (AME): Price and Financial Metrics
AME Price/Volume Stats
Current price | $182.90 | 52-week high | $186.32 |
Prev. close | $183.72 | 52-week low | $133.12 |
Day low | $182.56 | Volume | 1,043,500 |
Day high | $183.89 | Avg. volume | 969,933 |
50-day MA | $174.45 | Dividend yield | 0.61% |
200-day MA | $159.96 | Market Cap | 42.29B |
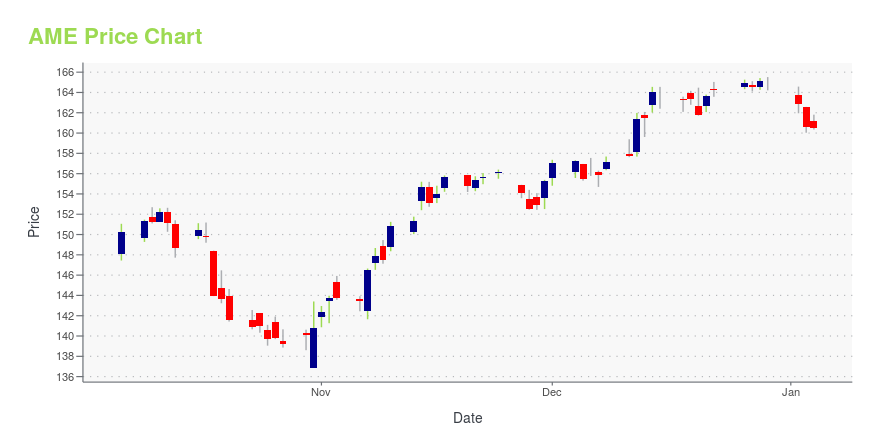
AME Stock Price Chart Interactive Chart >
AME POWR Grades
- AME scores best on the Stability dimension, with a Stability rank ahead of 91.85% of US stocks.
- The strongest trend for AME is in Growth, which has been heading down over the past 26 weeks.
- AME's current lowest rank is in the Value metric (where it is better than 8.89% of US stocks).
AME Stock Summary
- AME has a higher market value than 93% of US stocks; more precisely, its current market capitalization is $37,066,264,314.
- Of note is the ratio of AMETEK INC's sales and general administrative expense to its total operating expenses; 87.34% of US stocks have a lower such ratio.
- In terms of volatility of its share price, AME is more volatile than merely 6.06% of stocks we're observing.
- Stocks with similar financial metrics, market capitalization, and price volatility to AMETEK INC are HSY, PAYX, WIT, GPN, and KHC.
- Visit AME's SEC page to see the company's official filings. To visit the company's web site, go to www.ametek.com.
AME Valuation Summary
- In comparison to the median Industrials stock, AME's price/earnings ratio is 31.86% higher, now standing at 29.8.
- AME's price/sales ratio has moved up 4.3 over the prior 243 months.
Below are key valuation metrics over time for AME.
Stock | Date | P/S | P/B | P/E | EV/EBIT |
---|---|---|---|---|---|
AME | 2023-12-29 | 5.9 | 4.6 | 29.8 | 23.9 |
AME | 2023-12-28 | 5.9 | 4.6 | 29.8 | 23.9 |
AME | 2023-12-27 | 5.8 | 4.6 | 29.7 | 23.8 |
AME | 2023-12-26 | 5.9 | 4.6 | 29.8 | 23.9 |
AME | 2023-12-22 | 5.8 | 4.5 | 29.7 | 23.8 |
AME | 2023-12-21 | 5.8 | 4.5 | 29.6 | 23.7 |
AME Growth Metrics
- Its 5 year net income to common stockholders growth rate is now at 81.39%.
- Its year over year price growth rate is now at -8.62%.
- The 3 year revenue growth rate now stands at 16.7%.
The table below shows AME's growth in key financial areas (numbers in millions of US dollars).
Date | Revenue | Operating Cash Flow | Net Income to Common Stock |
---|---|---|---|
2022-12-31 | 6,150.53 | 1,149.373 | 1,159.542 |
2022-09-30 | 6,028.608 | 1,046.255 | 1,134.142 |
2022-06-30 | 5,917.503 | 1,026.251 | 1,093.961 |
2022-03-31 | 5,789.297 | 1,077.391 | 1,043.267 |
2021-12-31 | 5,546.514 | 1,160.457 | 990.053 |
2021-09-30 | 5,241.716 | 1,264.442 | 929.397 |
AME's Quality Factors
The “Quality” component of the POWR Ratings focuses on 31 different factors of a companies fundamentals and operational strength. Here are some key insights as we drill into the specifics of these quality attributes.- AME has a Quality Grade of C, ranking ahead of 69.7% of graded US stocks.
- AME's asset turnover comes in at 0.473 -- ranking 32nd of 53 Electrical Equipment stocks.
- AYI, BYRN, and RRX are the stocks whose asset turnover ratios are most correlated with AME.
The table below shows AME's key quality metrics over time.
Period | Asset Turnover | Gross Margin | ROIC |
---|---|---|---|
2021-09-30 | 0.473 | 0.347 | 0.331 |
2021-06-30 | 0.457 | 0.350 | 0.315 |
2021-03-31 | 0.437 | 0.350 | 0.286 |
2020-12-31 | 0.435 | 0.340 | 0.296 |
2020-09-30 | 0.451 | 0.336 | 0.288 |
2020-06-30 | 0.480 | 0.338 | 0.292 |
AME Price Target
For more insight on analysts targets of AME, see our AME price target page. And for a list of of all stocks sorted by upside potential based on analyst target price, see our Top Price Target page.
Average Price Target | $158.47 | Average Broker Recommendation | 1.56 (Moderate Buy) |
AMETEK Inc. (AME) Company Bio
AMETEK, Inc. is an American global manufacturer of electronic instruments and electromechanical devices with a headquarters in the United States and over 220 manufacturing sites worldwide. (Source:Wikipedia)
Latest AME News From Around the Web
Below are the latest news stories about AMETEK INC that investors may wish to consider to help them evaluate AME as an investment opportunity.
Those who invested in AMETEK (NYSE:AME) five years ago are up 152%The worst result, after buying shares in a company (assuming no leverage), would be if you lose all the money you put... |
AMETEK, Inc.'s (NYSE:AME) Shares May Have Run Too Fast Too SoonAMETEK, Inc.'s ( NYSE:AME ) price-to-earnings (or "P/E") ratio of 29.5x might make it look like a strong sell right now... |
AMETEK CEO David Zapico Sells 75,876 Shares: An Insider Sell AnalysisAMETEK Inc. (NYSE:AME), a leading global manufacturer of electronic instruments and electromechanical devices, has recently witnessed a significant insider sell by its Chief Executive Officer, David Zapico. |
Does AMETEK (NYSE:AME) Deserve A Spot On Your Watchlist?It's common for many investors, especially those who are inexperienced, to buy shares in companies with a good story... |
10 Best Mario Gabelli Stocks Other Billionaires Are Also Piling IntoIn this piece, we will take a look at the ten best Mario Gabelli stocks that other billionaires can’t get enough of. If you want to skip our overview of Mr. Gabelli and his hedge fund, then you can skip ahead to 5 Best Mario Gabelli Stocks Other Billionaires Are Also Piling Into. Mario Gabelli […] |
AME Price Returns
1-mo | 2.50% |
3-mo | 11.09% |
6-mo | 24.17% |
1-year | 28.88% |
3-year | 46.34% |
5-year | 127.94% |
YTD | 11.09% |
2023 | 18.81% |
2022 | -4.33% |
2021 | 22.32% |
2020 | 22.19% |
2019 | 48.27% |
AME Dividends
Ex-Dividend Date | Type | Payout Amount | Change | ||||||
---|---|---|---|---|---|---|---|---|---|
Loading, please wait... |
Continue Researching AME
Here are a few links from around the web to help you further your research on Ametek Inc's stock as an investment opportunity:Ametek Inc (AME) Stock Price | Nasdaq
Ametek Inc (AME) Stock Quote, History and News - Yahoo Finance
Ametek Inc (AME) Stock Price and Basic Information | MarketWatch
Loading social stream, please wait...