AMERISAFE, Inc. (AMSF): Price and Financial Metrics
AMSF Price/Volume Stats
Current price | $51.06 | 52-week high | $60.49 |
Prev. close | $51.41 | 52-week low | $44.72 |
Day low | $50.83 | Volume | 68,712 |
Day high | $51.50 | Avg. volume | 78,781 |
50-day MA | $52.68 | Dividend yield | 2.64% |
200-day MA | $52.13 | Market Cap | 977.90M |
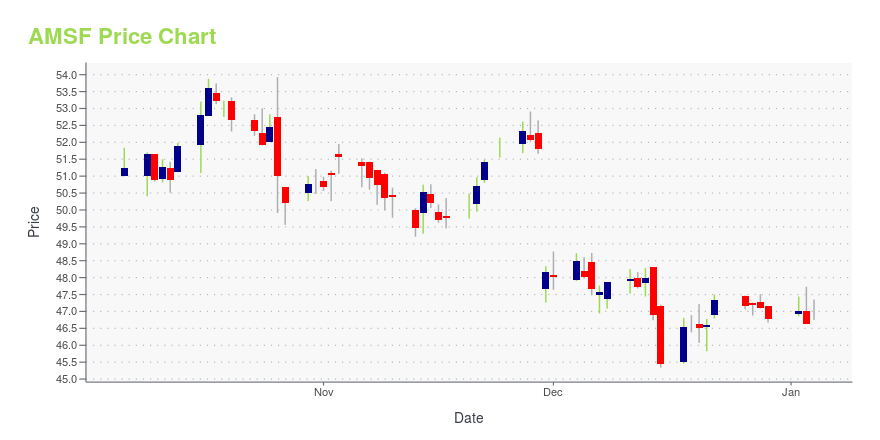
AMSF Stock Price Chart Interactive Chart >
AMSF POWR Grades
- AMSF scores best on the Momentum dimension, with a Momentum rank ahead of 87.05% of US stocks.
- The strongest trend for AMSF is in Growth, which has been heading down over the past 179 days.
- AMSF's current lowest rank is in the Value metric (where it is better than 19.77% of US stocks).
AMSF Stock Summary
- Of note is the ratio of AMERISAFE INC's sales and general administrative expense to its total operating expenses; 97.25% of US stocks have a lower such ratio.
- The ratio of debt to operating expenses for AMERISAFE INC is higher than it is for about merely 0.41% of US stocks.
- The volatility of AMERISAFE INC's share price is greater than that of merely 8.67% US stocks with at least 200 days of trading history.
- Stocks with similar financial metrics, market capitalization, and price volatility to AMERISAFE INC are PFSW, GIFI, TMST, IIIN, and CDRE.
- AMSF's SEC filings can be seen here. And to visit AMERISAFE INC's official web site, go to www.amerisafe.com.
AMSF Valuation Summary
- AMSF's price/sales ratio is 3.5; this is 59.09% higher than that of the median Financial Services stock.
- Over the past 213 months, AMSF's price/sales ratio has gone up 2.9.
Below are key valuation metrics over time for AMSF.
Stock | Date | P/S | P/B | P/E | EV/EBIT |
---|---|---|---|---|---|
AMSF | 2023-05-19 | 3.5 | 3.1 | 18.7 | 14.8 |
AMSF | 2023-05-18 | 3.5 | 3.2 | 18.9 | 14.9 |
AMSF | 2023-05-17 | 3.5 | 3.2 | 18.9 | 14.9 |
AMSF | 2023-05-16 | 3.6 | 3.2 | 19.1 | 15.1 |
AMSF | 2023-05-15 | 3.6 | 3.2 | 19.2 | 15.1 |
AMSF | 2023-05-12 | 3.6 | 3.2 | 19.2 | 15.2 |
AMSF Growth Metrics
- The 5 year net income to common stockholders growth rate now stands at 25.26%.
- Its 3 year net income to common stockholders growth rate is now at -14.81%.
- Its year over year revenue growth rate is now at -10.33%.

The table below shows AMSF's growth in key financial areas (numbers in millions of US dollars).
Date | Revenue | Operating Cash Flow | Net Income to Common Stock |
---|---|---|---|
2022-12-31 | 294.737 | 28.194 | 55.602 |
2022-09-30 | 293.357 | 44.621 | 38.365 |
2022-06-30 | 295.022 | 36.973 | 46.14 |
2022-03-31 | 308.143 | 28.504 | 63.775 |
2021-12-31 | 315.934 | 37.979 | 65.756 |
2021-09-30 | 325.774 | 41.954 | 90.716 |
AMSF's Quality Factors
The “Quality” component of the POWR Ratings focuses on 31 different factors of a companies fundamentals and operational strength. Here are some key insights as we drill into the specifics of these quality attributes.- AMSF has a Quality Grade of C, ranking ahead of 50.91% of graded US stocks.
- AMSF's asset turnover comes in at 0.219 -- ranking 75th of 133 Insurance stocks.
- EIG, JRVR, and MHLD are the stocks whose asset turnover ratios are most correlated with AMSF.
The table below shows AMSF's key quality metrics over time.
Period | Asset Turnover | Gross Margin | ROIC |
---|---|---|---|
2021-09-30 | 0.219 | 0.427 | 0.080 |
2021-06-30 | 0.223 | 0.428 | 0.081 |
2021-03-31 | 0.227 | 0.421 | 0.081 |
2020-12-31 | 0.223 | 0.397 | 0.074 |
2020-09-30 | 0.225 | 0.419 | 0.079 |
2020-06-30 | 0.229 | 0.401 | 0.078 |
AMSF Price Target
For more insight on analysts targets of AMSF, see our AMSF price target page. And for a list of of all stocks sorted by upside potential based on analyst target price, see our Top Price Target page.
Average Price Target | $71.50 | Average Broker Recommendation | 1.75 (Moderate Buy) |
AMERISAFE, Inc. (AMSF) Company Bio
Amerisafe is a specialty provider of workers' compensation insurance focused on small to mid-sized employers engaged in hazardous industries, principally construction, trucking, manufacturing, oil and gas and agriculture. The company was founded in 1985 and is based in DeRidder, Louisiana.
Latest AMSF News From Around the Web
Below are the latest news stories about AMERISAFE INC that investors may wish to consider to help them evaluate AMSF as an investment opportunity.
Surging Earnings Estimates Signal Upside for Amerisafe (AMSF) StockAmerisafe (AMSF) shares have started gaining and might continue moving higher in the near term, as indicated by solid earnings estimate revisions. |
Are Finance Stocks Lagging CME Group (CME) This Year?Here is how CME Group (CME) and Amerisafe (AMSF) have performed compared to their sector so far this year. |
AMERISAFE (AMSF) Shares Jump 4.8% Since Q1 Earnings BeatAMERISAFE's (AMSF) Q1 results reflect higher premiums earned, net investment income and fees and other income. Meanwhile, the elevated expense level partially offsets the positives. |
AMERISAFE First Quarter 2023 Earnings: Beats ExpectationsAMERISAFE ( NASDAQ:AMSF ) First Quarter 2023 Results Key Financial Results Revenue: US$78.5m (up 4.0% from 1Q 2022... |
Amerisafe (AMSF) Reports Q1 Earnings: What Key Metrics Have to SayWhile the top- and bottom-line numbers for Amerisafe (AMSF) give a sense of how the business performed in the quarter ended March 2023, it could be worth looking at how some of its key metrics compare to Wall Street estimates and year-ago values. |
AMSF Price Returns
1-mo | -8.41% |
3-mo | -4.90% |
6-mo | -5.09% |
1-year | 11.36% |
3-year | 7.67% |
5-year | 26.47% |
YTD | -1.11% |
2022 | 6.13% |
2021 | 2.00% |
2020 | -6.09% |
2019 | 24.48% |
2018 | -1.17% |
AMSF Dividends
Ex-Dividend Date | Type | Payout Amount | Change | ||||||
---|---|---|---|---|---|---|---|---|---|
Loading, please wait... |
Continue Researching AMSF
Want to see what other sources are saying about Amerisafe Inc's financials and stock price? Try the links below:Amerisafe Inc (AMSF) Stock Price | Nasdaq
Amerisafe Inc (AMSF) Stock Quote, History and News - Yahoo Finance
Amerisafe Inc (AMSF) Stock Price and Basic Information | MarketWatch
Loading social stream, please wait...