American Software, Inc. (AMSWA): Price and Financial Metrics
AMSWA Price/Volume Stats
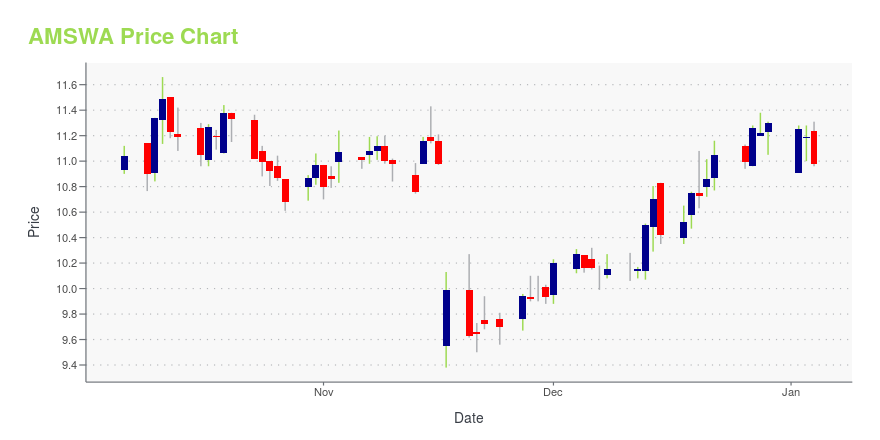
Current price | $11.45 | 52-week high | $13.72 |
Prev. close | $11.63 | 52-week low | $9.38 |
Day low | $11.43 | Volume | 138,700 |
Day high | $11.77 | Avg. volume | 189,055 |
50-day MA | $11.25 | Dividend yield | 3.83% |
200-day MA | $10.99 | Market Cap | 380.37M |
AMSWA Stock Price Chart Interactive Chart >
AMSWA POWR Grades
- AMSWA scores best on the Sentiment dimension, with a Sentiment rank ahead of 84.82% of US stocks.
- AMSWA's strongest trending metric is Sentiment; it's been moving down over the last 26 weeks.
- AMSWA's current lowest rank is in the Growth metric (where it is better than 2.46% of US stocks).
AMSWA Stock Summary
- AMSWA's went public 38.03 years ago, making it older than 92.92% of listed US stocks we're tracking.
- For AMSWA, its debt to operating expenses ratio is greater than that reported by just 0.22% of US equities we're observing.
- With a year-over-year growth in debt of -100%, AMERICAN SOFTWARE INC's debt growth rate surpasses merely 0% of about US stocks.
- Stocks with similar financial metrics, market capitalization, and price volatility to AMERICAN SOFTWARE INC are ISSC, AIRG, CRCT, TACT, and NTCT.
- AMSWA's SEC filings can be seen here. And to visit AMERICAN SOFTWARE INC's official web site, go to www.amsoftware.com.
AMSWA Valuation Summary
- AMSWA's EV/EBIT ratio is 18.5; this is 12.74% lower than that of the median Technology stock.
- AMSWA's EV/EBIT ratio has moved up 5.4 over the prior 243 months.
Below are key valuation metrics over time for AMSWA.
Stock | Date | P/S | P/B | P/E | EV/EBIT |
---|---|---|---|---|---|
AMSWA | 2023-12-08 | 2.9 | 2.5 | 31.4 | 18.5 |
AMSWA | 2023-12-07 | 2.9 | 2.5 | 31.4 | 18.5 |
AMSWA | 2023-12-06 | 2.9 | 2.5 | 31.5 | 18.5 |
AMSWA | 2023-12-05 | 2.9 | 2.5 | 31.5 | 18.5 |
AMSWA | 2023-12-04 | 2.9 | 2.5 | 31.8 | 18.8 |
AMSWA | 2023-12-01 | 2.9 | 2.5 | 31.6 | 18.6 |
AMSWA Growth Metrics
- The 3 year cash and equivalents growth rate now stands at 80.61%.
- Its 4 year price growth rate is now at 58.32%.
- Its 5 year revenue growth rate is now at 8.64%.
The table below shows AMSWA's growth in key financial areas (numbers in millions of US dollars).
Date | Revenue | Operating Cash Flow | Net Income to Common Stock |
---|---|---|---|
2022-09-30 | 129.805 | 10.047 | 10.735 |
2022-06-30 | 129.578 | 24.468 | 11.968 |
2022-03-31 | 127.553 | 29.02 | 12.782 |
2021-12-31 | 121.47 | 17.873 | 12.253 |
2021-09-30 | 116.731 | 18.697 | 11.624 |
2021-06-30 | 113.401 | 19.311 | 9.002 |
AMSWA's Quality Factors
The “Quality” component of the POWR Ratings focuses on 31 different factors of a companies fundamentals and operational strength. Here are some key insights as we drill into the specifics of these quality attributes.- AMSWA has a Quality Grade of B, ranking ahead of 82.47% of graded US stocks.
- AMSWA's asset turnover comes in at 0.659 -- ranking 243rd of 563 Business Services stocks.
- LPSN, GECC, and SPSC are the stocks whose asset turnover ratios are most correlated with AMSWA.
The table below shows AMSWA's key quality metrics over time.
Period | Asset Turnover | Gross Margin | ROIC |
---|---|---|---|
2021-07-31 | 0.659 | 0.561 | 1.001 |
2021-04-30 | 0.658 | 0.547 | 0.911 |
2021-01-31 | 0.668 | 0.537 | 0.513 |
2020-10-31 | 0.680 | 0.543 | 0.481 |
2020-07-31 | 0.679 | 0.544 | 0.431 |
2020-04-30 | 0.686 | 0.547 | 0.345 |
AMSWA Price Target
For more insight on analysts targets of AMSWA, see our AMSWA price target page. And for a list of of all stocks sorted by upside potential based on analyst target price, see our Top Price Target page.
Average Price Target | $31.25 | Average Broker Recommendation | 1.33 (Strong Buy) |
American Software, Inc. (AMSWA) Company Bio
American Software, Inc. develops, markets, and supports a portfolio of software and services that deliver enterprise management and collaborative supply chain solutions worldwide. It operates in three segments: Supply Chain Management (SCM), Enterprise Resource Planning (ERP), and Information Technology (IT) Consulting. The company was founded in 1970 and is based in Atlanta, Georgia.
Latest AMSWA News From Around the Web
Below are the latest news stories about AMERICAN SOFTWARE INC that investors may wish to consider to help them evaluate AMSWA as an investment opportunity.
American Software's (AMSWA) Logility Bolsters AI EffortsAmerican Software (AMSWA) expands as Logility upgrades its SaaS platform with improved AI and ML capabilities. |
Logility Newest Release Advances Artificial Intelligence and Machine Learning Across SaaS PlatformATLANTA, December 20, 2023--Logility, Inc., a leader in prescriptive supply chain planning solutions, today announced new functionality to its cloud-based (SaaS) Logility® Digital Supply Chain Platform. New features leverage artificial intelligence (AI), machine learning (ML), and automation to continuously sense, analyze, and update activity in your digital supply chains. The release also deepens inventory, manufacturing, and ESG capabilities within the Logility platform. |
American Software (NASDAQ:AMSW.A) Is Due To Pay A Dividend Of $0.11American Software, Inc. ( NASDAQ:AMSW.A ) will pay a dividend of $0.11 on the 16th of February. The dividend yield will... |
American Software files FY23 10-K/A and Q1 FY24 10-Q/AATLANTA, December 11, 2023--American Software, Inc. (NASDAQ: AMSWA) today announced that it filed a Form 10-K/A for the year ended April 30, 2023 and Form 10-Q/A for the three month period ended July 31, 2023 related to a material weakness in its internal control over financial reporting. |
Logility Maximizes Production Efficiencies with Advanced Scheduling CapabilitiesATLANTA, November 27, 2023--Logility, Inc., a leader in prescriptive supply chain planning solutions, today announced the extension of its robust Manufacturing Optimization solution. Advanced scheduling capabilities such as Synchronous Scheduling and Flexible Scripts are designed to further maximize production efficiencies. These capabilities deliver a highly configurable solution to meet diverse scheduling needs in a wide range of industries, including consumer goods, food and beverage, and ind |
AMSWA Price Returns
1-mo | -0.35% |
3-mo | 2.32% |
6-mo | 1.90% |
1-year | -0.26% |
3-year | -37.79% |
5-year | 10.13% |
YTD | 2.32% |
2023 | -20.22% |
2022 | -42.55% |
2021 | 55.44% |
2020 | 18.56% |
2019 | 47.12% |
AMSWA Dividends
Ex-Dividend Date | Type | Payout Amount | Change | ||||||
---|---|---|---|---|---|---|---|---|---|
Loading, please wait... |
Continue Researching AMSWA
Want to do more research on American Software Inc's stock and its price? Try the links below:American Software Inc (AMSWA) Stock Price | Nasdaq
American Software Inc (AMSWA) Stock Quote, History and News - Yahoo Finance
American Software Inc (AMSWA) Stock Price and Basic Information | MarketWatch
Loading social stream, please wait...