The Andersons, Inc. (ANDE): Price and Financial Metrics
GET POWR RATINGS... FREE!
ANDE POWR Grades
- Value is the dimension where ANDE ranks best; there it ranks ahead of 87.54% of US stocks.
- The strongest trend for ANDE is in Quality, which has been heading up over the past 179 days.
- ANDE ranks lowest in Momentum; there it ranks in the 20th percentile.
ANDE Stock Summary
- The capital turnover (annual revenue relative to shareholder's equity) for ANDE is 14.45 -- better than 97.6% of US stocks.
- With a price/sales ratio of 0.08, ANDERSONS INC has a higher such ratio than only 1.51% of stocks in our set.
- Shareholder yield, a measure of how much is returned to shareholders via dividends and share repurchases, for ANDE comes in at 21.97% -- higher than that of 91.91% of stocks in our set.
- If you're looking for stocks that are quantitatively similar to ANDERSONS INC, a group of peers worth examining would be HBI, UNFI, PFGC, AN, and SPTN.
- Visit ANDE's SEC page to see the company's official filings. To visit the company's web site, go to www.andersonsinc.com.
ANDE Valuation Summary
- ANDE's EV/EBIT ratio is 10.2; this is 48.74% lower than that of the median Consumer Defensive stock.
- Over the past 243 months, ANDE's price/earnings ratio has gone up 5.1.
Below are key valuation metrics over time for ANDE.
Stock | Date | P/S | P/B | P/E | EV/EBIT |
---|---|---|---|---|---|
ANDE | 2023-02-24 | 0.1 | 1.3 | 11.6 | 10.2 |
ANDE | 2023-02-23 | 0.1 | 1.2 | 11.3 | 10.0 |
ANDE | 2023-02-22 | 0.1 | 1.2 | 9.8 | 10.8 |
ANDE | 2023-02-21 | 0.1 | 1.2 | 9.8 | 10.9 |
ANDE | 2023-02-17 | 0.1 | 1.3 | 10.0 | 11.0 |
ANDE | 2023-02-16 | 0.1 | 1.3 | 9.9 | 10.9 |
ANDE Growth Metrics
- The 4 year revenue growth rate now stands at 106.91%.
- Its year over year net income to common stockholders growth rate is now at 56.06%.
- Its 4 year net income to common stockholders growth rate is now at -123.11%.

The table below shows ANDE's growth in key financial areas (numbers in millions of US dollars).
Date | Revenue | Operating Cash Flow | Net Income to Common Stock |
---|---|---|---|
2022-12-31 | 17,325.38 | 287.117 | 131.08 |
2022-09-30 | 16,430.6 | -323.487 | 151.698 |
2022-06-30 | 15,210.1 | -527.355 | 130.688 |
2022-03-31 | 14,033.21 | -680.321 | 94.382 |
2021-12-31 | 12,612.05 | -51.05 | 103.986 |
2021-09-30 | 11,451.2 | -151.156 | 90.335 |
ANDE's Quality Factors
The “Quality” component of the POWR Ratings focuses on 31 different factors of a companies fundamentals and operational strength. Here are some key insights as we drill into the specifics of these quality attributes.- ANDE has a Quality Grade of C, ranking ahead of 34.75% of graded US stocks.
- ANDE's asset turnover comes in at 2.594 -- ranking 21st of 105 Wholesale stocks.
- MMLP, AEY, and KAMN are the stocks whose asset turnover ratios are most correlated with ANDE.
The table below shows ANDE's key quality metrics over time.
Period | Asset Turnover | Gross Margin | ROIC |
---|---|---|---|
2021-06-30 | 2.594 | 0.051 | 0.040 |
2021-03-31 | 2.358 | 0.052 | 0.031 |
2020-12-31 | 2.227 | 0.049 | 0.015 |
2020-09-30 | 2.102 | 0.054 | 0.014 |
2020-06-30 | 2.138 | 0.055 | 0.013 |
2020-03-31 | 2.218 | 0.059 | 0.021 |
ANDE Price Target
For more insight on analysts targets of ANDE, see our ANDE price target page. And for a list of of all stocks sorted by upside potential based on analyst target price, see our Top Price Target page.
Average Price Target | $36.00 | Average Broker Recommendation | 1.75 (Moderate Buy) |
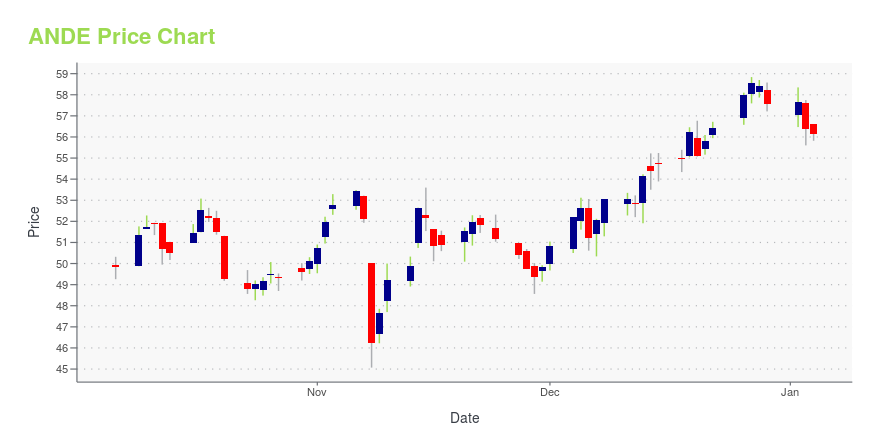
ANDE Stock Price Chart Interactive Chart >
ANDE Price/Volume Stats
Current price | $40.03 | 52-week high | $59.00 |
Prev. close | $39.21 | 52-week low | $29.35 |
Day low | $38.50 | Volume | 161,500 |
Day high | $40.03 | Avg. volume | 234,058 |
50-day MA | $40.09 | Dividend yield | 1.89% |
200-day MA | $36.32 | Market Cap | 1.35B |
The Andersons, Inc. (ANDE) Company Bio
The Andersons Inc. engages in the grain, ethanol, plant nutrient, railcar leasing, turf and cob products, and consumer retailing businesses in the United States and internationally. It operates through six segments: Grain, Ethanol, Rail, Plant Nutrient, Turf & Specialty, and Retail. The company was founded in 1947 and is based in Maumee, Ohio.
Latest ANDE News From Around the Web
Below are the latest news stories about ANDERSONS INC that investors may wish to consider to help them evaluate ANDE as an investment opportunity.
7 Stocks Set to Soar When the Market RecoversAlthough investors are freaking out over the banking sector fallout, bold contrarians may consider these stocks to buy. |
Strength Seen in Bunge (BG): Can Its 14.5% Jump Turn into More Strength?Bunge (BG) was a big mover last session on higher-than-average trading volume. The latest trend in earnings estimate revisions might not help the stock continue moving higher in the near term. |
Here's Why Andersons (NASDAQ:ANDE) Has Caught The Eye Of InvestorsThe excitement of investing in a company that can reverse its fortunes is a big draw for some speculators, so even... |
7 Agriculture Stocks That Can Ride Out Market VolatilityWhile it might not be the most thrilling sector, agriculture stocks to buy may be the most important based on global events. |
Andersons (NASDAQ:ANDE) Has Affirmed Its Dividend Of $0.185The Andersons, Inc. ( NASDAQ:ANDE ) has announced that it will pay a dividend of $0.185 per share on the 24th of April... |
ANDE Price Returns
1-mo | -11.91% |
3-mo | N/A |
6-mo | 28.87% |
1-year | -26.02% |
3-year | 144.90% |
5-year | 38.62% |
YTD | 14.40% |
2022 | -7.77% |
2021 | 61.48% |
2020 | 0.81% |
2019 | -13.20% |
2018 | -2.10% |
ANDE Dividends
Ex-Dividend Date | Type | Payout Amount | Change | ||||||
---|---|---|---|---|---|---|---|---|---|
Loading, please wait... |
Continue Researching ANDE
Want to see what other sources are saying about Andersons Inc's financials and stock price? Try the links below:Andersons Inc (ANDE) Stock Price | Nasdaq
Andersons Inc (ANDE) Stock Quote, History and News - Yahoo Finance
Andersons Inc (ANDE) Stock Price and Basic Information | MarketWatch
Loading social stream, please wait...