ANSYS Inc. (ANSS): Price and Financial Metrics
GET POWR RATINGS... FREE!
ANSS POWR Grades
- Quality is the dimension where ANSS ranks best; there it ranks ahead of 83.67% of US stocks.
- ANSS's strongest trending metric is Stability; it's been moving down over the last 179 days.
- ANSS's current lowest rank is in the Momentum metric (where it is better than 28.53% of US stocks).
ANSS Stock Summary
- With a market capitalization of $28,580,906,551, Ansys Inc has a greater market value than 90.46% of US stocks.
- With a one year PEG ratio of 1,389.4, Ansys Inc is expected to have a higher PEG ratio (a measure of how expensive a stock is relative to its expected earnings growth) than 97.7% of US stocks.
- With a price/sales ratio of 14.99, Ansys Inc has a higher such ratio than 90.46% of stocks in our set.
- Stocks that are quantitatively similar to ANSS, based on their financial statements, market capitalization, and price volatility, are NTRA, ROKU, TWTR, WK, and BHVN.
- Visit ANSS's SEC page to see the company's official filings. To visit the company's web site, go to www.ansys.com.
ANSS Valuation Summary
- ANSS's EV/EBIT ratio is 60.1; this is 86.36% higher than that of the median Technology stock.
- Over the past 243 months, ANSS's EV/EBIT ratio has gone up 47.2.
- Over the past 243 months, ANSS's price/sales ratio has gone up 14.5.
Below are key valuation metrics over time for ANSS.
Stock | Date | P/S | P/B | P/E | EV/EBIT |
---|---|---|---|---|---|
ANSS | 2021-09-01 | 17.9 | 7.6 | 70.6 | 60.1 |
ANSS | 2021-08-31 | 17.7 | 7.5 | 69.7 | 59.4 |
ANSS | 2021-08-30 | 17.7 | 7.5 | 69.8 | 59.4 |
ANSS | 2021-08-27 | 17.7 | 7.5 | 69.6 | 59.3 |
ANSS | 2021-08-26 | 17.5 | 7.4 | 68.9 | 58.7 |
ANSS | 2021-08-25 | 17.7 | 7.5 | 69.8 | 59.4 |
ANSS Growth Metrics
- Its 5 year net income to common stockholders growth rate is now at 62.59%.
- Its 3 year price growth rate is now at 128.49%.
- Its year over year net cashflow from operations growth rate is now at 15.18%.

The table below shows ANSS's growth in key financial areas (numbers in millions of US dollars).
Date | Revenue | Operating Cash Flow | Net Income to Common Stock |
---|---|---|---|
2021-12-31 | 1,906.715 | 549.482 | 454.627 |
2021-09-30 | 1,874.734 | 621.596 | 467.088 |
2021-06-30 | 1,800.531 | 558.29 | 457.373 |
2021-03-31 | 1,739.538 | 571.005 | 460.221 |
2020-12-31 | 1,681.297 | 547.31 | 433.887 |
2020-09-30 | 1,543.839 | 512.994 | 384.107 |
ANSS's Quality Factors
The “Quality” component of the POWR Ratings focuses on 31 different factors of a companies fundamentals and operational strength. Here are some key insights as we drill into the specifics of these quality attributes.- ANSS has a Quality Grade of B, ranking ahead of 81.31% of graded US stocks.
- ANSS's asset turnover comes in at 0.32 -- ranking 423rd of 561 Business Services stocks.
- TTEK, BGSF, and CSGP are the stocks whose asset turnover ratios are most correlated with ANSS.
The table below shows ANSS's key quality metrics over time.
Period | Asset Turnover | Gross Margin | ROIC |
---|---|---|---|
2021-06-30 | 0.320 | 0.863 | 0.405 |
2021-03-31 | 0.327 | 0.864 | 0.429 |
2020-12-31 | 0.337 | 0.866 | 0.461 |
2020-09-30 | 0.327 | 0.866 | 0.448 |
2020-06-30 | 0.345 | 0.872 | 0.546 |
2020-03-31 | 0.365 | 0.879 | 0.675 |
ANSS Price Target
For more insight on analysts targets of ANSS, see our ANSS price target page. And for a list of of all stocks sorted by upside potential based on analyst target price, see our Top Price Target page.
Average Price Target | $389.77 | Average Broker Recommendation | 1.72 (Moderate Buy) |
ANSS Stock Price Chart Interactive Chart >
ANSS Price/Volume Stats
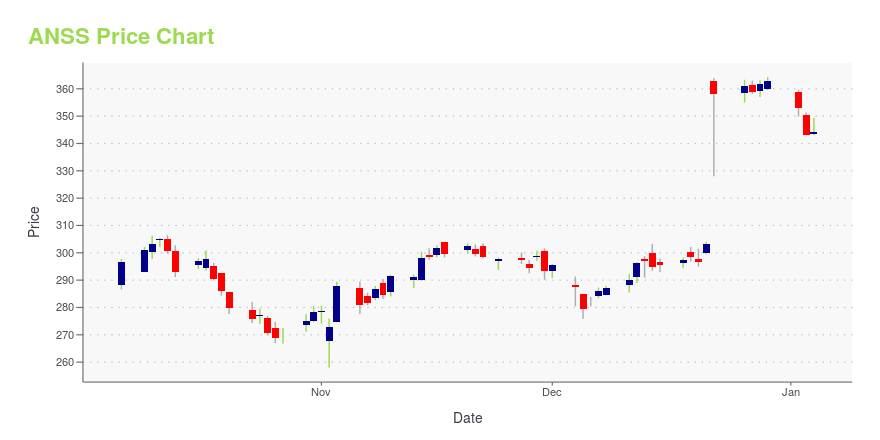
Current price | $252.15 | 52-week high | $413.89 |
Prev. close | $248.00 | 52-week low | $230.72 |
Day low | $244.15 | Volume | 461,000 |
Day high | $254.01 | Avg. volume | 561,960 |
50-day MA | $287.55 | Dividend yield | N/A |
200-day MA | $343.62 | Market Cap | 21.93B |
ANSYS Inc. (ANSS) Company Bio
Ansys is an American company based in Canonsburg, Pennsylvania. It develops and markets CAE/multiphysics engineering simulation software for product design, testing and operation and offers its products and services to customers worldwide. (Source:Wikipedia)
Latest ANSS News From Around the Web
Below are the latest news stories about Ansys Inc that investors may wish to consider to help them evaluate ANSS as an investment opportunity.
How Much Upside is Left in Ansys (ANSS)? Wall Street Analysts Think 26%The average of price targets set by Wall Street analysts indicates a potential upside of 26.5% in Ansys (ANSS). While the effectiveness of this highly sought-after metric is questionable, the positive trend in earnings estimate revisions might translate into an upside in the stock. |
Ansys keeps its eyes on the cloud, posts strong annual resultsAnsys also reported that its high-tech and semiconductor, aerospace and defense, and automotive and ground transportation sectors also saw their respective strongest year-over-year growth in company history. |
ANSYS (ANSS) Q4 Earnings and Revenues Surpass EstimatesANSYS' (ANSS) Q4 performance is driven by strength in its product portfolio. |
Ansys (ANSS) Beats Q4 Earnings and Revenue EstimatesAnsys (ANSS) delivered earnings and revenue surprises of 4.85% and 3.95%, respectively, for the quarter ended December 2021. Do the numbers hold clues to what lies ahead for the stock? |
Ansys Announces Financial Results With Record Q4 and FY 2021 ACV and RevenueInitiates Q1 and FY 2022 OutlookDetails related to our financial guidance, including assumptions, are included in our prepared remarks document. / Key Highlights - Q4 2021 GAAP revenue of $655.7 million and non-GAAP revenue of $661.4 millionGAAP diluted earnings per share of $2.30 and non-GAAP diluted earnings per share of $2.81GAAP operating profit margin of 36.4% and non-GAAP operating profit margin of 46.8%Operating cash flows of $101.7 millionAnnual contract value (ACV) of $755.4 million / K |
ANSS Price Returns
1-mo | -13.42% |
3-mo | -15.83% |
6-mo | -37.36% |
1-year | -24.44% |
3-year | 35.67% |
5-year | 106.34% |
YTD | -37.14% |
2021 | 10.26% |
2020 | 41.33% |
2019 | 80.08% |
2018 | -3.15% |
2017 | 59.57% |
Continue Researching ANSS
Here are a few links from around the web to help you further your research on Ansys Inc's stock as an investment opportunity:Ansys Inc (ANSS) Stock Price | Nasdaq
Ansys Inc (ANSS) Stock Quote, History and News - Yahoo Finance
Ansys Inc (ANSS) Stock Price and Basic Information | MarketWatch
Loading social stream, please wait...