Aon PLC (AON): Price and Financial Metrics
GET POWR RATINGS... FREE!
AON POWR Grades
- Sentiment is the dimension where AON ranks best; there it ranks ahead of 85.68% of US stocks.
- AON's strongest trending metric is Growth; it's been moving down over the last 179 days.
- AON's current lowest rank is in the Value metric (where it is better than 8.3% of US stocks).
AON Stock Summary
- AON has a market capitalization of $66,151,568,933 -- more than approximately 96.61% of US stocks.
- AON PLC's capital turnover -- a measure of revenue relative to shareholder's equity -- is better than only 1.25% of US listed stocks.
- Equity multiplier, or assets relative to shareholders' equity, comes in at 61.41 for AON PLC; that's greater than it is for 99.51% of US stocks.
- Stocks that are quantitatively similar to AON, based on their financial statements, market capitalization, and price volatility, are AMP, COHN, TISI, EQH, and JXN.
- Visit AON's SEC page to see the company's official filings. To visit the company's web site, go to www.aon.com.
AON Valuation Summary
- AON's price/earnings ratio is 23.5; this is 100.85% higher than that of the median Financial Services stock.
- AON's price/sales ratio has moved up 4.7 over the prior 243 months.
Below are key valuation metrics over time for AON.
Stock | Date | P/S | P/B | P/E | EV/EBIT |
---|---|---|---|---|---|
AON | 2023-02-06 | 5.3 | -83.9 | 23.5 | 20.1 |
AON | 2023-02-03 | 5.2 | -82.9 | 23.2 | 19.9 |
AON | 2023-02-02 | 5.4 | -85.3 | 23.9 | 20.4 |
AON | 2023-02-01 | 5.3 | -84.4 | 23.6 | 20.2 |
AON | 2023-01-31 | 5.3 | -84.2 | 23.6 | 20.2 |
AON | 2023-01-30 | 5.3 | -83.9 | 23.5 | 20.1 |
AON Growth Metrics
- Its 4 year cash and equivalents growth rate is now at 59.35%.
- The 4 year revenue growth rate now stands at -1.13%.
- The 2 year cash and equivalents growth rate now stands at -13.77%.

The table below shows AON's growth in key financial areas (numbers in millions of US dollars).
Date | Revenue | Operating Cash Flow | Net Income to Common Stock |
---|---|---|---|
2022-09-30 | 12,429 | 3,108 | 2,795 |
2022-06-30 | 12,435 | 1,968 | 1,487 |
2022-03-31 | 12,338 | 2,084 | 1,365 |
2021-12-31 | 12,193 | 2,182 | 1,255 |
2021-09-30 | 12,078 | 2,011 | 916 |
2021-06-30 | 11,761 | 2,909 | 2,091 |
AON's Quality Factors
The “Quality” component of the POWR Ratings focuses on 31 different factors of a companies fundamentals and operational strength. Here are some key insights as we drill into the specifics of these quality attributes.- AON has a Quality Grade of C, ranking ahead of 69.81% of graded US stocks.
- AON's asset turnover comes in at 0.37 -- ranking 40th of 133 Insurance stocks.
- RGA, AXS, and JRVR are the stocks whose asset turnover ratios are most correlated with AON.
The table below shows AON's key quality metrics over time.
Period | Asset Turnover | Gross Margin | ROIC |
---|---|---|---|
2021-09-30 | 0.370 | 1 | 0.133 |
2021-06-30 | 0.361 | 1 | 0.227 |
2021-03-31 | 0.356 | 1 | 0.219 |
2020-12-31 | 0.352 | 1 | 0.210 |
2020-09-30 | 0.357 | 1 | 0.198 |
2020-06-30 | 0.366 | 1 | 0.197 |
AON Price Target
For more insight on analysts targets of AON, see our AON price target page. And for a list of of all stocks sorted by upside potential based on analyst target price, see our Top Price Target page.
Average Price Target | $283.18 | Average Broker Recommendation | 1.82 (Hold) |
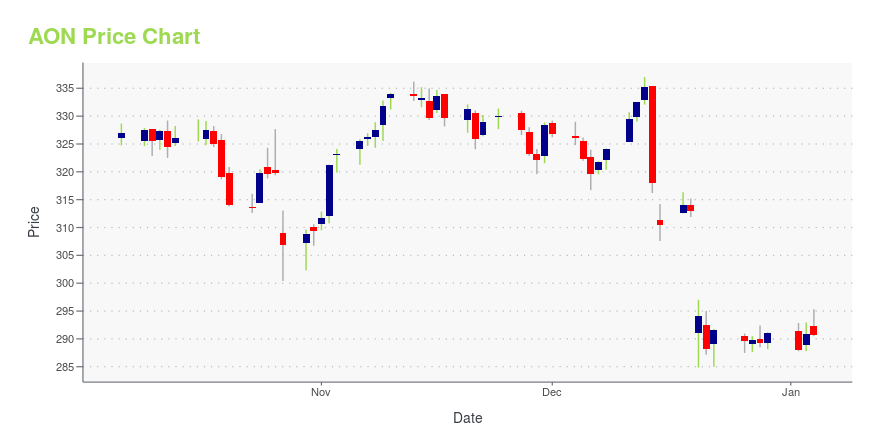
AON Stock Price Chart Interactive Chart >
AON Price/Volume Stats
Current price | $319.61 | 52-week high | $341.98 |
Prev. close | $319.80 | 52-week low | $246.21 |
Day low | $317.32 | Volume | 660,900 |
Day high | $321.86 | Avg. volume | 804,927 |
50-day MA | $309.98 | Dividend yield | N/A |
200-day MA | $287.92 | Market Cap | 66.11B |
Aon PLC (AON) Company Bio
Aon plc (English: /ˈeɪɒn/) is a British-American multinational professional services firm that sells a range of financial risk-mitigation products, including insurance, pension administration, and health-insurance plans. Aon has approximately 50,000 employees in 120 countries. (Source:Wikipedia)
Latest AON News From Around the Web
Below are the latest news stories about AON PLC that investors may wish to consider to help them evaluate AON as an investment opportunity.
Aon plc (NYSE:AON) Q4 2022 Earnings Call TranscriptAon plc (NYSE:AON) Q4 2022 Earnings Call Transcript February 3, 2023 Operator: Good morning and thank you for holding. Welcome to Aon plc’s Fourth Quarter and Full Year 2022 Conference Call. I would like to also remind parties that this call is being recorded. If anyone has an objection, you may disconnect your line at […] |
Aon Full Year 2022 Earnings: EPS Misses ExpectationsAon ( NYSE:AON ) Full Year 2022 Results Key Financial Results Revenue: US$12.5b (up 2.3% from FY 2021). Net income... |
Top 5 4th Quarter Trades of FCF Advisors LLCRelated Stocks: OGS , MRK , AON , SHW , META , |
Aon: Q4 Earnings Snapshot_ Aon PLC on Friday reported fourth-quarter profit of $657 million. The average estimate of seven analysts surveyed by Zacks Investment Research was for earnings of $3.67 per share. Aon shares have climbed roughly 8% since the beginning of the year, while the S&P''s 500 index has risen nearly 9%. |
Aon Reports Fourth Quarter and Full Year 2022 ResultsFourth Quarter Key Metrics and Highlights Total revenue increased 2% to $3.1 billion , including organic revenue growth of 5% Operating margin increased 70 basis points to 32.3%, and operating margin, adjusted for certain items, increased 40 basis points to 33.2% EPS decreased 19% to $3.14 , and EPS, adjusted for certain items, increased 5% to $3.89 Repurchased 2.3 million class A ordinary shares for approximately $675 million Announced the acquisition of ERN, a Mexico -based leader in risk assessment modeling, expanding Aon''s catastrophe modeling and consulting capabilities in Latin America Full Year Key Metrics and Highlights Total revenue increased 2% to $12.5 billion , including organic revenue growth of 6% Operating margin increased 1,230 basis points to 29.4%, and operating margi... |
AON Price Returns
1-mo | 4.18% |
3-mo | 9.27% |
6-mo | 6.41% |
1-year | 9.60% |
3-year | 41.72% |
5-year | 142.86% |
YTD | 6.68% |
2022 | 0.61% |
2021 | 43.39% |
2020 | 2.37% |
2019 | 44.68% |
2018 | 9.94% |
Continue Researching AON
Here are a few links from around the web to help you further your research on Aon plc's stock as an investment opportunity:Aon plc (AON) Stock Price | Nasdaq
Aon plc (AON) Stock Quote, History and News - Yahoo Finance
Aon plc (AON) Stock Price and Basic Information | MarketWatch
Loading social stream, please wait...