
A.O. Smith Corp. (AOS): Price and Financial Metrics
AOS Price/Volume Stats
| Current price | $84.50 | 52-week high | $92.44 |
| Prev. close | $82.18 | 52-week low | $64.14 |
| Day low | $83.30 | Volume | 1,149,759 |
| Day high | $84.91 | Avg. volume | 958,061 |
| 50-day MA | $83.75 | Dividend yield | 1.59% |
| 200-day MA | $81.07 | Market Cap | 12.39B |
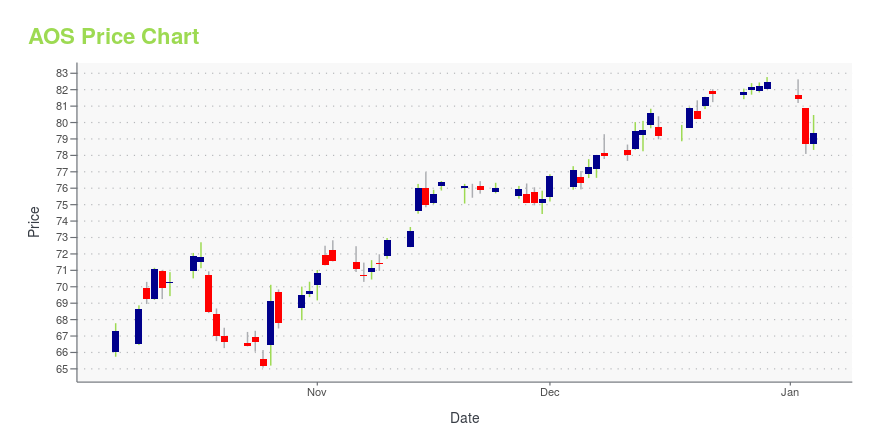
AOS Stock Price Chart Interactive Chart >
A.O. Smith Corp. (AOS) Company Bio
A. O. Smith Corporation is an American manufacturer of both residential and commercial water heaters and boilers and the largest manufacturer and marketer of water heaters in North America. It also supplies water treatment products in the Asian market. The company has 24 locations worldwide, including five manufacturing facilities in North America, as well as plants in Bengaluru in India, Nanjing in China and Veldhoven in The Netherlands. (Source:Wikipedia)
Latest AOS News From Around the Web
Below are the latest news stories about SMITH A O CORP that investors may wish to consider to help them evaluate AOS as an investment opportunity.
Buy 5 Manufacturing Stocks Despite Disappointing November PMIWe have narrowed our search to five manufacturing stocks with strong potential for 2024. These are: EMR, ETN, AMCR, XYL, AOS. |
Should You Sell A. O. Smith Corporation (AOS) Now?TimesSquare Capital Management, an equity investment management company, released its “U.S. Mid Cap Growth Strategy” third-quarter investor letter. A copy of the same can be downloaded here. In the third quarter, the strategy outperformed the Russell Midcap Growth Index and returned -4.11% (net) while the index return was -5.22%. The third quarter saw a decline in […] |
Here's Why A.O. Smith (AOS) is a Strong Momentum StockThe Zacks Style Scores offers investors a way to easily find top-rated stocks based on their investing style. Here's why you should take advantage. |
Why This 1 Growth Stock Could Be a Great Addition to Your PortfolioWhether you're a value, growth, or momentum investor, finding strong stocks becomes easier with the Zacks Style Scores, a top feature of the Zacks Premium research service. |
If You Invested $1000 in A.O. Smith a Decade Ago, This is How Much It'd Be Worth NowInvesting in certain stocks can pay off in the long run, especially if you hold on for a decade or more. |
AOS Price Returns
| 1-mo | 2.57% |
| 3-mo | 1.94% |
| 6-mo | 5.24% |
| 1-year | 16.60% |
| 3-year | 27.05% |
| 5-year | 106.43% |
| YTD | 3.30% |
| 2023 | 46.68% |
| 2022 | -32.07% |
| 2021 | 59.28% |
| 2020 | 17.46% |
| 2019 | 13.65% |
AOS Dividends
| Ex-Dividend Date | Type | Payout Amount | Change | ||||||
|---|---|---|---|---|---|---|---|---|---|
| Loading, please wait... | |||||||||
Continue Researching AOS
Here are a few links from around the web to help you further your research on Smith A O Corp's stock as an investment opportunity:Smith A O Corp (AOS) Stock Price | Nasdaq
Smith A O Corp (AOS) Stock Quote, History and News - Yahoo Finance
Smith A O Corp (AOS) Stock Price and Basic Information | MarketWatch
Loading social stream, please wait...