Apache Corporation (APA): Price and Financial Metrics
GET POWR RATINGS... FREE!
APA POWR Grades
- APA scores best on the Momentum dimension, with a Momentum rank ahead of 99.98% of US stocks.
- APA's strongest trending metric is Stability; it's been moving up over the last 179 days.
- APA ranks lowest in Stability; there it ranks in the 14th percentile.
APA Stock Summary
- The capital turnover (annual revenue relative to shareholder's equity) for APA is -4.97 -- better than merely 2.22% of US stocks.
- APA's went public 36.27 years ago, making it older than 92.84% of listed US stocks we're tracking.
- Equity multiplier, or assets relative to shareholders' equity, comes in at -10.84 for APA Corp; that's greater than it is for only 1.75% of US stocks.
- Stocks that are quantitatively similar to APA, based on their financial statements, market capitalization, and price volatility, are ELP, GOL, HMLP, X, and PFX.
- APA's SEC filings can be seen here. And to visit APA Corp's official web site, go to www.apachecorp.com.
APA Valuation Summary
- In comparison to the median Energy stock, APA's EV/EBIT ratio is 44.35% lower, now standing at 10.1.
- Over the past 243 months, APA's price/sales ratio has gone down 0.8.
- APA's price/sales ratio has moved down 0.8 over the prior 243 months.
Below are key valuation metrics over time for APA.
Stock | Date | P/S | P/B | P/E | EV/EBIT |
---|---|---|---|---|---|
APA | 2021-09-03 | 1.2 | -80.8 | 10.5 | 10.1 |
APA | 2021-09-02 | 1.2 | -81.6 | 10.6 | 10.2 |
APA | 2021-09-01 | 1.1 | -78.3 | 10.1 | 10.0 |
APA | 2021-08-31 | 1.2 | -80.0 | 10.4 | 10.1 |
APA | 2021-08-30 | 1.1 | -76.7 | 9.9 | 9.9 |
APA | 2021-08-27 | 1.1 | -77.0 | 10.0 | 9.9 |
APA Growth Metrics
- Its year over year price growth rate is now at 81.73%.
- Its year over year net cashflow from operations growth rate is now at -43.81%.
- Its 4 year net income to common stockholders growth rate is now at 57.87%.

The table below shows APA's growth in key financial areas (numbers in millions of US dollars).
Date | Revenue | Operating Cash Flow | Net Income to Common Stock |
---|---|---|---|
2021-12-31 | 7,928 | 3,496 | 973 |
2021-09-30 | 6,814 | 2,909 | 601 |
2021-06-30 | 6,307 | 2,442 | 710 |
2021-03-31 | 5,121 | 1,557 | 8 |
2020-12-31 | 4,308 | 1,388 | -4,860 |
2020-09-30 | 4,644 | 1,668 | -7,846 |
APA's Quality Factors
The “Quality” component of the POWR Ratings focuses on 31 different factors of a companies fundamentals and operational strength. Here are some key insights as we drill into the specifics of these quality attributes.- APA has a Quality Grade of A, ranking ahead of 96.94% of graded US stocks.
- APA's asset turnover comes in at 0.483 -- ranking 49th of 136 Petroleum and Natural Gas stocks.
- SD, CPE, and DWSN are the stocks whose asset turnover ratios are most correlated with APA.
The table below shows APA's key quality metrics over time.
Period | Asset Turnover | Gross Margin | ROIC |
---|---|---|---|
2021-06-30 | 0.483 | 0.335 | 0.076 |
2021-03-31 | 0.396 | 0.213 | 0.027 |
2020-12-31 | 0.331 | 0.088 | -0.223 |
2020-09-30 | 0.324 | -0.017 | -0.343 |
2020-06-30 | 0.300 | -0.025 | -0.318 |
2020-03-31 | 0.318 | 0.095 | -0.277 |
APA Price Target
For more insight on analysts targets of APA, see our APA price target page. And for a list of of all stocks sorted by upside potential based on analyst target price, see our Top Price Target page.
Average Price Target | $27.59 | Average Broker Recommendation | 1.74 (Moderate Buy) |
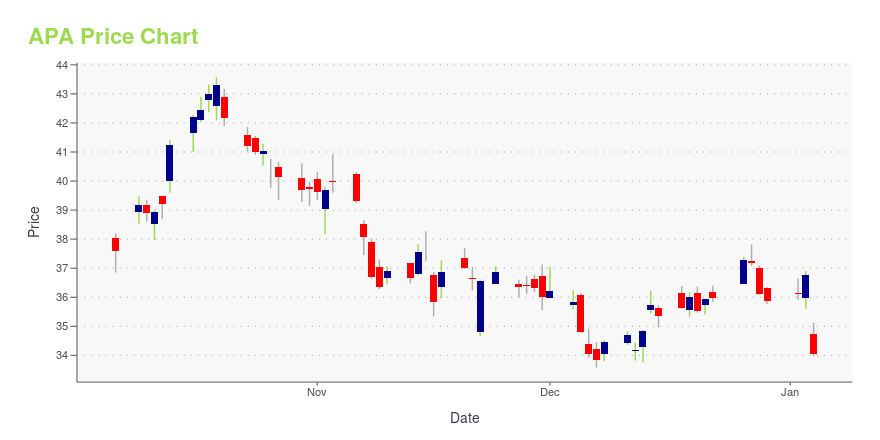
APA Stock Price Chart Interactive Chart >
APA Price/Volume Stats
Current price | $34.93 | 52-week high | $51.95 |
Prev. close | $36.10 | 52-week low | $15.55 |
Day low | $34.70 | Volume | 358,902 |
Day high | $35.31 | Avg. volume | 9,657,037 |
50-day MA | $42.51 | Dividend yield | 1.39% |
200-day MA | $33.74 | Market Cap | 11.81B |
Apache Corporation (APA) Company Bio
Apache Corporation explores, develops, and produces natural gas, crude oil, and natural gas liquids in the Permian Basin, the Anadarko basin in western Oklahoma, and the Texas Panhandle, Gulf Coast areas of the United States, as well as in Western Canada. The company was founded in 1954 and is based in Houston, Texas.
Latest APA News From Around the Web
Below are the latest news stories about APA Corp that investors may wish to consider to help them evaluate APA as an investment opportunity.
Delaware Basin-focused midstream cos. complete merger, reveal new nameThe combined company bills itself as the only “pure-play” midstream company operating in the Delaware Basin. |
Dave Stover Appointed to APA Corporation Board of DirectorsHOUSTON, Feb. 23, 2022 (GLOBE NEWSWIRE) -- APA Corporation (Nasdaq: APA) today announced the appointment of Dave Stover to its board of directors. Stover is expected to serve on the Audit Committee. “We are thrilled to welcome Dave to the APA board. With more than 40 years of domestic and international oil and gas industry experience, he will bring in-depth knowledge and global expertise to our ongoing efforts to deliver long-term value for APA stakeholders,” said John Lowe, APA’s nonexecutive b |
Could The APA Corporation (NASDAQ:APA) Ownership Structure Tell Us Something Useful?The big shareholder groups in APA Corporation ( NASDAQ:APA ) have power over the company. Institutions will often hold... |
APA Non-GAAP EPS of $1.29 misses by $0.17, revenue of $2.3B beats by $360MAPA press release (NASDAQ:APA): Q4 Non-GAAP EPS of $1.29 misses by $0.17. Revenue of $2.3B (+78.3% Y/Y) beats by $360M. Reported production of 386,000 barrels of oil equivalent (BOE) per day; adjusted production, which excludes Egypt noncontrolling interest and tax barrels, was 331,000 BOE per day. Delivered net cash from... |
APA Corporation: A Winner Since December With More Upside On The HorizonIn December 2021, I recommended purchasing shares of APA Corporation (APA), a US oil and gas producer. Subscribers to my weekly report at Seeking Alpha received a buy recommendation on Dec. 16 when the stock was at the $25.10 level. Crude oil and natural gas companies had not participated in... |
APA Price Returns
1-mo | -25.70% |
3-mo | -17.03% |
6-mo | 30.77% |
1-year | 63.18% |
3-year | 25.79% |
5-year | -19.53% |
YTD | 30.77% |
2021 | 90.76% |
2020 | -43.71% |
2019 | 1.12% |
2018 | -36.39% |
2017 | -32.13% |
APA Dividends
Ex-Dividend Date | Type | Payout Amount | Change | ||||||
---|---|---|---|---|---|---|---|---|---|
Loading, please wait... |
Continue Researching APA
Want to see what other sources are saying about Apache Corp's financials and stock price? Try the links below:Apache Corp (APA) Stock Price | Nasdaq
Apache Corp (APA) Stock Quote, History and News - Yahoo Finance
Apache Corp (APA) Stock Price and Basic Information | MarketWatch
Loading social stream, please wait...