
Artisan Partners Asset Management Inc. (APAM): Price and Financial Metrics
APAM Price/Volume Stats
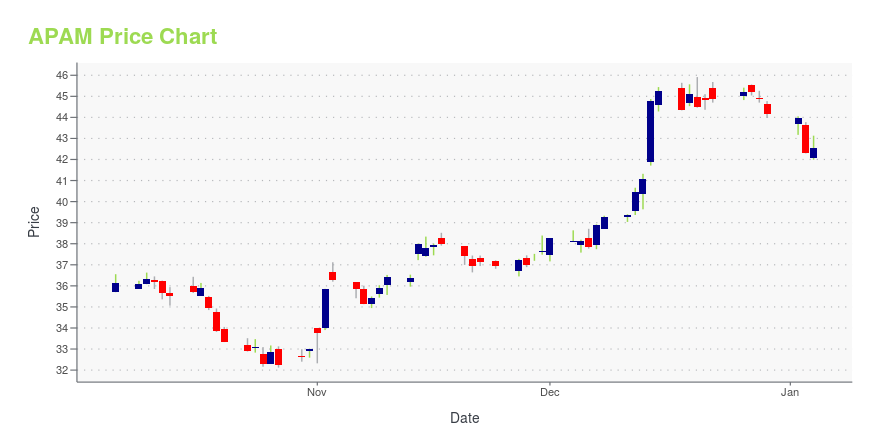
| Current price | $43.71 | 52-week high | $46.75 |
| Prev. close | $43.16 | 52-week low | $32.12 |
| Day low | $43.22 | Volume | 347,043 |
| Day high | $43.95 | Avg. volume | 462,066 |
| 50-day MA | $42.34 | Dividend yield | 5.73% |
| 200-day MA | $41.45 | Market Cap | 3.51B |
APAM Stock Price Chart Interactive Chart >
Artisan Partners Asset Management Inc. (APAM) Company Bio
Artisan Partners Asset Management provides its services to pension and profit sharing plans, trusts, endowments, foundations, charitable organizations, government entities, private funds and non-U.S. funds, as well as mutual funds, non-U.S. funds and collective trusts. It manages separate client-focused equity and fixed income portfolios. The company was founded in 1994 and is based in Milwaukee, Wisconsin.
Latest APAM News From Around the Web
Below are the latest news stories about ARTISAN PARTNERS ASSET MANAGEMENT INC that investors may wish to consider to help them evaluate APAM as an investment opportunity.
Artisan Partners Asset Management Inc. Reports November 2023 Assets Under ManagementMILWAUKEE, Dec. 11, 2023 (GLOBE NEWSWIRE) -- Artisan Partners Asset Management Inc. (NYSE: APAM) today reported that its preliminary assets under management ("AUM") as of November 30, 2023 totaled $143.1 billion. Artisan Funds and Artisan Global Funds accounted for $69.4 billion of total firm AUM, while separate accounts and other AUM1 accounted for $73.7 billion. In November, certain Artisan Funds made their annual income and capital gains distributions. November month-end AUM includes the impa |
Robust AUM Supports Artisan Partners (APAM), High Costs AilArtisan Partners' (APAM) revenue growth is supported by robust AUM. However, rising operating expenses on investments in technology pose a major concern. |
Artisan Partners (APAM) Up 10.6% Since Last Earnings Report: Can It Continue?Artisan Partners (APAM) reported earnings 30 days ago. What's next for the stock? We take a look at earnings estimates for some clues. |
Here's What We Like About Artisan Partners Asset Management's (NYSE:APAM) Upcoming DividendRegular readers will know that we love our dividends at Simply Wall St, which is why it's exciting to see Artisan... |
Artisan Partners Asset Management Inc. Reports October 2023 Assets Under ManagementMILWAUKEE, Wis., Nov. 09, 2023 (GLOBE NEWSWIRE) -- Artisan Partners Asset Management Inc. (NYSE: APAM) today reported that its preliminary assets under management ("AUM") as of October 31, 2023 totaled $132.2 billion. Artisan Funds and Artisan Global Funds accounted for $64.6 billion of total firm AUM, while separate accounts and other AUM1 accounted for $67.6 billion. PRELIMINARY ASSETS UNDER MANAGEMENT BY STRATEGY2 As of October 31, 2023 - ($ Millions) Growth Team Global Opportunities$ 18,044 |
APAM Price Returns
| 1-mo | 7.95% |
| 3-mo | 5.56% |
| 6-mo | 8.96% |
| 1-year | 14.01% |
| 3-year | 16.84% |
| 5-year | 124.72% |
| YTD | 2.79% |
| 2023 | 60.26% |
| 2022 | -31.31% |
| 2021 | 2.74% |
| 2020 | 71.01% |
| 2019 | 66.94% |
APAM Dividends
| Ex-Dividend Date | Type | Payout Amount | Change | ||||||
|---|---|---|---|---|---|---|---|---|---|
| Loading, please wait... | |||||||||
Continue Researching APAM
Here are a few links from around the web to help you further your research on Artisan Partners Asset Management Inc's stock as an investment opportunity:Artisan Partners Asset Management Inc (APAM) Stock Price | Nasdaq
Artisan Partners Asset Management Inc (APAM) Stock Quote, History and News - Yahoo Finance
Artisan Partners Asset Management Inc (APAM) Stock Price and Basic Information | MarketWatch
Loading social stream, please wait...