
Apollo Global Management Inc. (APO): Price and Financial Metrics
APO Price/Volume Stats
| Current price | $122.16 | 52-week high | $125.31 |
| Prev. close | $121.66 | 52-week low | $77.11 |
| Day low | $121.09 | Volume | 2,097,681 |
| Day high | $123.74 | Avg. volume | 2,367,437 |
| 50-day MA | $117.70 | Dividend yield | 1.48% |
| 200-day MA | $104.55 | Market Cap | 69.41B |
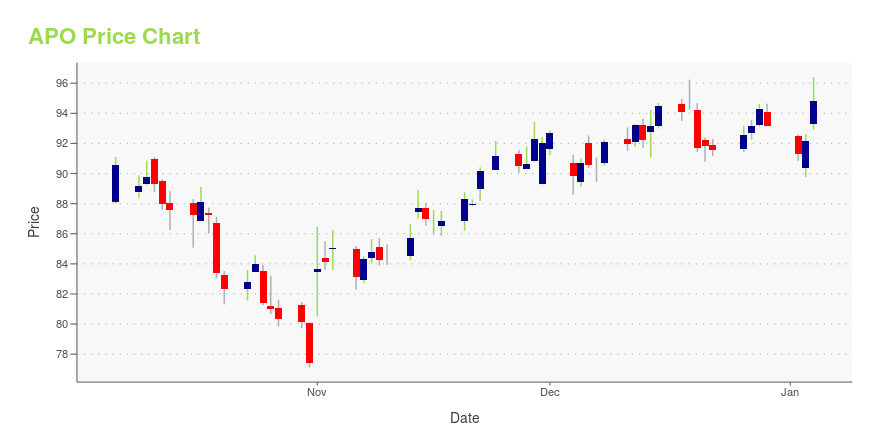
APO Stock Price Chart Interactive Chart >
Apollo Global Management Inc. (APO) Company Bio
Apollo Global Management, Inc. is an American global private equity firm. It provides investment management and invests in credit, private equity, and real assets. As of March 31, 2022, the company had $512 billion of assets under management, including $372 billion invested in credit, including mezzanine capital, hedge funds, non-performing loans and collateralized loan obligations, $80.7 billion invested in private equity, and $46.2 billion invested in real assets, which includes real estate and infrastructure. The company invests money on behalf of pension funds, financial endowments and sovereign wealth funds, as well as other institutional and individual investors. Since inception in 1990, private equity funds managed by Apollo have produced a 24% internal rate of return (IRR) to investors, net of fees. (Source:Wikpedia)
Latest APO News From Around the Web
Below are the latest news stories about APOLLO GLOBAL MANAGEMENT INC that investors may wish to consider to help them evaluate APO as an investment opportunity.
3 Asset Managers Set to Continue Their Winning Streak in 2024Despite the tough operating backdrop, KKR, Apollo Global (APO) and Victory Capital (VCTR) remain poised for AUM growth in 2024, supported by decent asset inflows. |
Private Equity Firm Warburg Taps Apollo for $1 Billion Loan to Bypass Banks(Bloomberg) -- Warburg Pincus turned to investment giant Apollo Global Management Inc. for a $1 billion loan to pay down bank facilities involving an older fund.Most Read from BloombergHyperloop One to Shut Down After Failing to Reinvent TransitHarvard Financial Pain Grows as Blavatnik Joins Donor RevoltVilified Zero-Day Options Blamed by Traders for S&P DeclineGiuliani Files for Bankruptcy After $148 Million Defamation LossTencent Leads $80 Billion Rout as China Rekindles Crackdown FearThe loan |
Apollo-owned Aspen Insurance files for US IPOAspen went private in 2019, after funds affiliated to Apollo Global Management agreed to buy it in an all-cash deal valued at $2.6 billion. Shares of Fidelis Insurance and Hamilton Insurance are trading below their IPO price after their market debuts. For the nine months ended Sept. 30, Aspen reported a net income of $305.2 million, compared with a loss of $112.8 million a year earlier. |
Here’s How Apollo Global Management (APO) GrewInvestment management company Ave Maria recently released its “Ave Maria Focused Fund” third quarter 2023 investor letter. A copy of the same can be downloaded here. In the third quarter, the fund returned -2.37% compared to the S&P MidCap 400 Growth Index’s -3.25% return. Year-to-date the fund returned 21.03% compared to the 6.88% return for the […] |
Blackstone Channels Taylor Swift in 'Alternatives Era' Holiday VideoPrivate-equity firms aren't usually known for their sense of humor. The video features executives singing and dancing in sequins, preceded by a skit where employees scramble to deliver on Blackstone President Jonathan Gray's vision. "Alternatives" ties into the company's description of itself as an "alternative asset manager," a more expansive remit than a plain vanilla private-equity company, and a contrast to traditional money managers that focus on publicly traded stocks and bonds. |
APO Price Returns
| 1-mo | 3.47% |
| 3-mo | 9.30% |
| 6-mo | 22.74% |
| 1-year | 54.13% |
| 3-year | 121.63% |
| 5-year | 300.75% |
| YTD | 32.11% |
| 2023 | 49.44% |
| 2022 | -9.59% |
| 2021 | 53.25% |
| 2020 | 8.00% |
| 2019 | 106.46% |
APO Dividends
| Ex-Dividend Date | Type | Payout Amount | Change | ||||||
|---|---|---|---|---|---|---|---|---|---|
| Loading, please wait... | |||||||||
Continue Researching APO
Want to see what other sources are saying about Apollo Global Management Inc's financials and stock price? Try the links below:Apollo Global Management Inc (APO) Stock Price | Nasdaq
Apollo Global Management Inc (APO) Stock Quote, History and News - Yahoo Finance
Apollo Global Management Inc (APO) Stock Price and Basic Information | MarketWatch
Loading social stream, please wait...