
Digital Turbine, Inc. (APPS): Price and Financial Metrics
APPS Price/Volume Stats
| Current price | $6.03 | 52-week high | $7.77 |
| Prev. close | $5.85 | 52-week low | $1.18 |
| Day low | $5.66 | Volume | 3,750,000 |
| Day high | $6.15 | Avg. volume | 6,273,906 |
| 50-day MA | $4.64 | Dividend yield | N/A |
| 200-day MA | $3.21 | Market Cap | 645.10M |
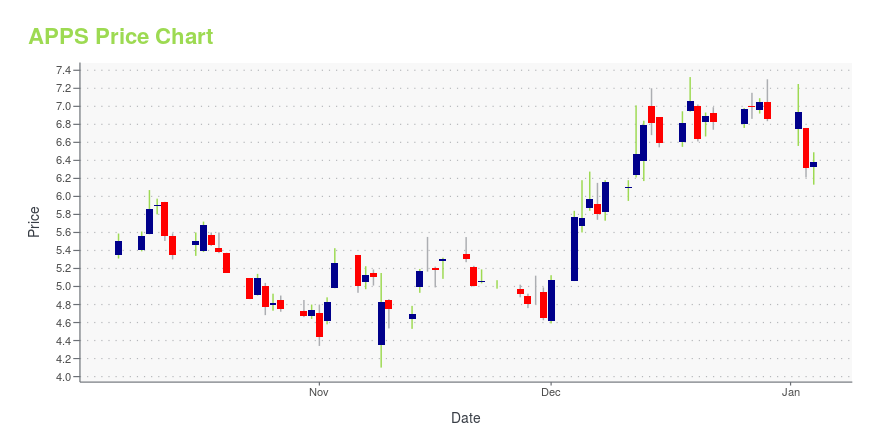
APPS Stock Price Chart Interactive Chart >
APPS Price Returns
| 1-mo | 7.49% |
| 3-mo | 164.47% |
| 6-mo | 197.04% |
| 1-year | 256.80% |
| 3-year | -66.63% |
| 5-year | -52.67% |
| YTD | 256.80% |
| 2024 | -75.36% |
| 2023 | -54.99% |
| 2022 | -75.01% |
| 2021 | 7.83% |
| 2020 | 693.27% |
Continue Researching APPS
Want to see what other sources are saying about Digital Turbine Inc's financials and stock price? Try the links below:Digital Turbine Inc (APPS) Stock Price | Nasdaq
Digital Turbine Inc (APPS) Stock Quote, History and News - Yahoo Finance
Digital Turbine Inc (APPS) Stock Price and Basic Information | MarketWatch
Loading social stream, please wait...