
Digital Turbine, Inc. (APPS): Price and Financial Metrics
APPS Price/Volume Stats
| Current price | $2.37 | 52-week high | $11.01 |
| Prev. close | $2.32 | 52-week low | $1.39 |
| Day low | $2.30 | Volume | 1,011,066 |
| Day high | $2.42 | Avg. volume | 2,317,570 |
| 50-day MA | $1.90 | Dividend yield | N/A |
| 200-day MA | $3.69 | Market Cap | 242.94M |
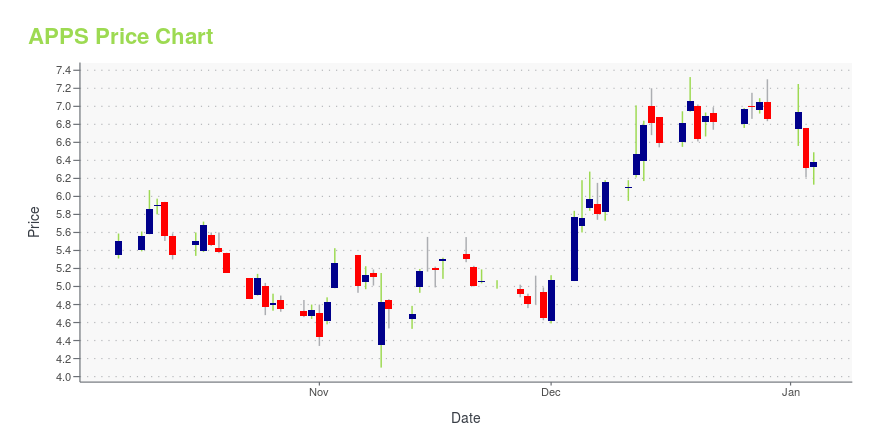
APPS Stock Price Chart Interactive Chart >
Latest APPS News From Around the Web
Below are the latest news stories about DIGITAL TURBINE INC that investors may wish to consider to help them evaluate APPS as an investment opportunity.
Digital Turbine, Inc.'s (NASDAQ:APPS) Intrinsic Value Is Potentially 93% Above Its Share PriceKey Insights Digital Turbine's estimated fair value is US$9.76 based on 2 Stage Free Cash Flow to Equity Digital... |
Digital Turbine, Inc. (NASDAQ:APPS) Q2 2024 Earnings Call TranscriptDigital Turbine, Inc. (NASDAQ:APPS) Q2 2024 Earnings Call Transcript November 8, 2023 Operator: Good afternoon and welcome to the Digital Turbine Reports Fiscal 2024 Second Quarter Results Conference Call. [Operator Instructions] Please note that this event is being recorded. I would now like to turn the conference over to Brian Bartholomew, Senior Vice President of […] |
Twilio, Yeti and 3 Other Popular Earnings ChartsThese five companies are some of the most popular stocks to report this week. All of them had out-performance during the pandemic but sold off in 2022. |
Digital Turbine Inc (APPS) Faces Fiscal Challenges Despite Solid Cash Flow in Q2 FY2024Revenue Declines as Company Navigates Market Headwinds |
Digital Turbine Reports Fiscal 2024 Second Quarter Financial ResultsDigital Turbine, Inc. (Nasdaq: APPS) announced financial results for the fiscal second quarter ended September 30, 2023. |
APPS Price Returns
| 1-mo | 66.90% |
| 3-mo | 30.22% |
| 6-mo | -58.57% |
| 1-year | -76.95% |
| 3-year | -96.10% |
| 5-year | -54.60% |
| YTD | -65.45% |
| 2023 | -54.99% |
| 2022 | -75.01% |
| 2021 | 7.83% |
| 2020 | 693.27% |
| 2019 | 289.62% |
Continue Researching APPS
Want to see what other sources are saying about Digital Turbine Inc's financials and stock price? Try the links below:Digital Turbine Inc (APPS) Stock Price | Nasdaq
Digital Turbine Inc (APPS) Stock Quote, History and News - Yahoo Finance
Digital Turbine Inc (APPS) Stock Price and Basic Information | MarketWatch
Loading social stream, please wait...