Alexandria Real Estate Equities Inc. (ARE): Price and Financial Metrics
GET POWR RATINGS... FREE!
ARE POWR Grades
- Growth is the dimension where ARE ranks best; there it ranks ahead of 89.45% of US stocks.
- ARE's strongest trending metric is Stability; it's been moving up over the last 177 days.
- ARE ranks lowest in Value; there it ranks in the 13th percentile.
ARE Stock Summary
- ALEXANDRIA REAL ESTATE EQUITIES INC's market capitalization of $20,746,218,248 is ahead of 90.19% of US-listed equities.
- Of note is the ratio of ALEXANDRIA REAL ESTATE EQUITIES INC's sales and general administrative expense to its total operating expenses; just 10.83% of US stocks have a lower such ratio.
- For ARE, its debt to operating expenses ratio is greater than that reported by 95.04% of US equities we're observing.
- If you're looking for stocks that are quantitatively similar to ALEXANDRIA REAL ESTATE EQUITIES INC, a group of peers worth examining would be WPC, SBAC, KIM, SUI, and DLR.
- ARE's SEC filings can be seen here. And to visit ALEXANDRIA REAL ESTATE EQUITIES INC's official web site, go to www.are.com.
ARE Valuation Summary
- ARE's price/sales ratio is 7.8; this is 100% higher than that of the median Real Estate stock.
- ARE's price/sales ratio has moved up 2.3 over the prior 243 months.
Below are key valuation metrics over time for ARE.
Stock | Date | P/S | P/B | P/E | EV/EBIT |
---|---|---|---|---|---|
ARE | 2023-03-23 | 7.8 | 1.1 | 39.1 | 47.7 |
ARE | 2023-03-22 | 7.8 | 1.1 | 39.5 | 48.0 |
ARE | 2023-03-21 | 8.2 | 1.1 | 41.5 | 49.7 |
ARE | 2023-03-20 | 8.1 | 1.1 | 41.1 | 49.4 |
ARE | 2023-03-17 | 8.1 | 1.1 | 40.8 | 49.1 |
ARE | 2023-03-16 | 8.3 | 1.1 | 41.8 | 50.0 |
ARE Growth Metrics
- The 3 year cash and equivalents growth rate now stands at 175.54%.
- The 5 year net cashflow from operations growth rate now stands at 85.44%.
- Its 3 year revenue growth rate is now at 64.65%.

The table below shows ARE's growth in key financial areas (numbers in millions of US dollars).
Date | Revenue | Operating Cash Flow | Net Income to Common Stock |
---|---|---|---|
2022-12-31 | 2,588.962 | 1,294.321 | 513.268 |
2022-09-30 | 2,495.604 | 1,142.718 | 531.866 |
2022-06-30 | 2,383.511 | 1,088.503 | 291.691 |
2022-03-31 | 2,249.366 | 989.23 | 402.974 |
2021-12-31 | 2,114.15 | 1,010.197 | 563.399 |
2021-09-30 | 2,000.947 | 934.206 | 924.554 |
ARE's Quality Factors
The “Quality” component of the POWR Ratings focuses on 31 different factors of a companies fundamentals and operational strength. Here are some key insights as we drill into the specifics of these quality attributes.- ARE has a Quality Grade of C, ranking ahead of 29.61% of graded US stocks.
- ARE's asset turnover comes in at 0.077 -- ranking 268th of 444 Trading stocks.
- PIPR, BSIG, and MKTX are the stocks whose asset turnover ratios are most correlated with ARE.
The table below shows ARE's key quality metrics over time.
Period | Asset Turnover | Gross Margin | ROIC |
---|---|---|---|
2021-09-30 | 0.077 | 0.708 | 0.032 |
2021-06-30 | 0.082 | 0.720 | 0.033 |
2021-03-31 | 0.086 | 0.720 | 0.031 |
2020-12-31 | 0.089 | 0.719 | 0.033 |
2020-09-30 | 0.091 | 0.718 | 0.026 |
2020-06-30 | 0.089 | 0.707 | 0.023 |
ARE Price Target
For more insight on analysts targets of ARE, see our ARE price target page. And for a list of of all stocks sorted by upside potential based on analyst target price, see our Top Price Target page.
Average Price Target | $216.68 | Average Broker Recommendation | 1.32 (Strong Buy) |
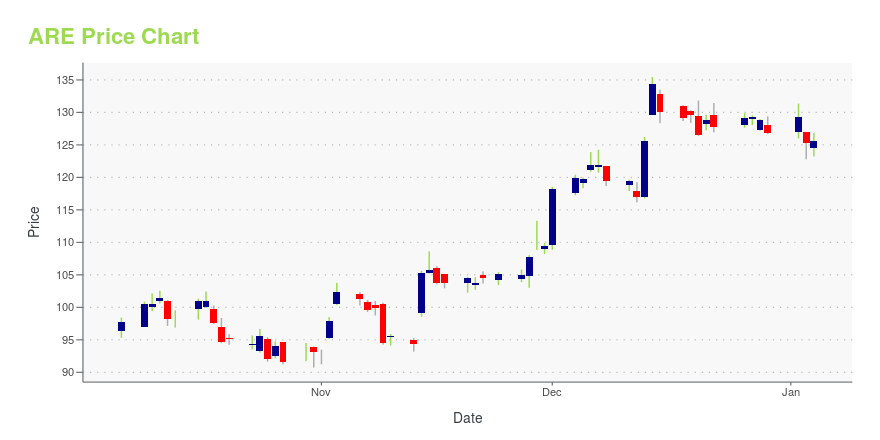
ARE Stock Price Chart Interactive Chart >
ARE Price/Volume Stats
Current price | $123.74 | 52-week high | $206.85 |
Prev. close | $123.98 | 52-week low | $114.94 |
Day low | $122.92 | Volume | 310,426 |
Day high | $124.99 | Avg. volume | 1,094,713 |
50-day MA | $146.01 | Dividend yield | 3.93% |
200-day MA | $147.82 | Market Cap | 21.42B |
Alexandria Real Estate Equities Inc. (ARE) Company Bio
Alexandria Real Estate Equities, Inc. is an American real estate investment trust that invests in office buildings and laboratories leased to tenants in the life science and technology industries. (Source:Wikipedia)
Latest ARE News From Around the Web
Below are the latest news stories about ALEXANDRIA REAL ESTATE EQUITIES INC that investors may wish to consider to help them evaluate ARE as an investment opportunity.
These 4 Top Dividend Stocks Have 22% to 47% Upside Potential, According to Wall StreetShares of real estate investment trusts (REITs) have gotten hammered over the past year because of the surge in interest rates. Four that stand out to analysts for their upside potential are Alexandria Real Estate Equities (NYSE: ARE), American Tower (NYSE: AMT), Community Healthcare Trust (NYSE: CHCT), and VICI Properties (NYSE: VICI). |
Are You Looking for a High-Growth Dividend Stock?Dividends are one of the best benefits to being a shareholder, but finding a great dividend stock is no easy task. Does Alexandria Real Estate Equities (ARE) have what it takes? Let's find out. |
Improve Your Retirement Income with These 3 Top-Ranked Dividend StocksThe traditional retirement planning approaches no longer cover all expenses in nest egg years. So what can retirees do? Thankfully, there are alternative investments that provide steady, higher-rate income streams to replace dwindling bond yields. |
Want to Invest in Real Estate With Less Stress? Try This REIT.Alexandria Real Estate Equities has been sold off. But don't dismiss this lab space landlord and dividend machine. |
These 3 Dividend Stocks Can Help Beat the Spring Market MalaiseThe stock market hasn't been a comfortable place for investors this year. While 2023 started with a bit of a bounceback, volatility has returned heading toward the spring on concerns about weakness in the banking industry. Three that stand out to a few Fool.com contributors right now are Realty Income (NYSE: O), Tanger Factory Outlet Centers (NYSE: SKT) and Alexandria Real Estate Equities (NYSE: ARE), and . |
ARE Price Returns
1-mo | -12.55% |
3-mo | -14.21% |
6-mo | -10.10% |
1-year | -36.33% |
3-year | -1.84% |
5-year | 14.13% |
YTD | -14.21% |
2022 | -32.63% |
2021 | 28.09% |
2020 | 13.27% |
2019 | 44.04% |
2018 | -8.97% |
ARE Dividends
Ex-Dividend Date | Type | Payout Amount | Change | ||||||
---|---|---|---|---|---|---|---|---|---|
Loading, please wait... |
Continue Researching ARE
Here are a few links from around the web to help you further your research on Alexandria Real Estate Equities Inc's stock as an investment opportunity:Alexandria Real Estate Equities Inc (ARE) Stock Price | Nasdaq
Alexandria Real Estate Equities Inc (ARE) Stock Quote, History and News - Yahoo Finance
Alexandria Real Estate Equities Inc (ARE) Stock Price and Basic Information | MarketWatch
Loading social stream, please wait...