Apollo Commercial Real Estate Finance, Inc (ARI): Price and Financial Metrics
ARI Price/Volume Stats
Current price | $10.38 | 52-week high | $12.74 |
Prev. close | $10.25 | 52-week low | $7.91 |
Day low | $10.28 | Volume | 779,161 |
Day high | $10.47 | Avg. volume | 1,079,485 |
50-day MA | $10.88 | Dividend yield | 12.89% |
200-day MA | $10.75 | Market Cap | 1.47B |
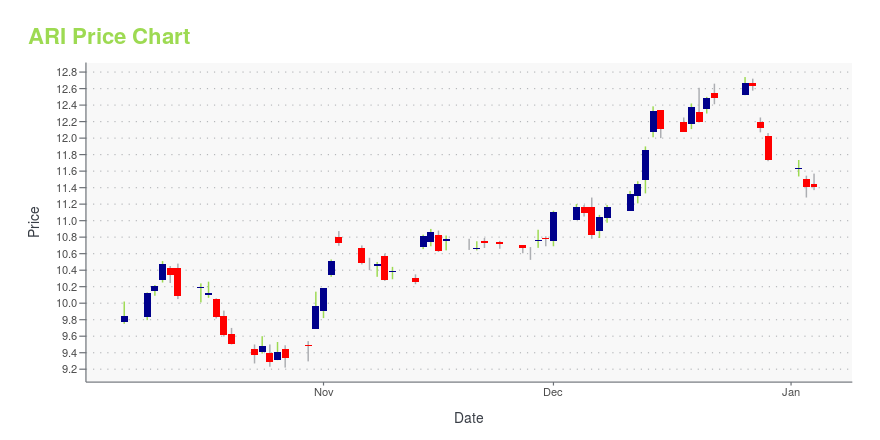
ARI Stock Price Chart Interactive Chart >
ARI POWR Grades
- Value is the dimension where ARI ranks best; there it ranks ahead of 77.19% of US stocks.
- The strongest trend for ARI is in Growth, which has been heading down over the past 179 days.
- ARI ranks lowest in Growth; there it ranks in the 2nd percentile.
ARI Stock Summary
- The capital turnover (annual revenue relative to shareholder's equity) for ARI is 0.15 -- better than just 15.48% of US stocks.
- The ratio of debt to operating expenses for APOLLO COMMERCIAL REAL ESTATE FINANCE INC is higher than it is for about 98.33% of US stocks.
- APOLLO COMMERCIAL REAL ESTATE FINANCE INC's shareholder yield -- a measure of how much capital is returned to stockholders via dividends and buybacks -- is 22.69%, greater than the shareholder yield of 92.23% of stocks in our set.
- Stocks that are quantitatively similar to ARI, based on their financial statements, market capitalization, and price volatility, are ACRE, SAFE, VEL, CMTG, and LADR.
- ARI's SEC filings can be seen here. And to visit APOLLO COMMERCIAL REAL ESTATE FINANCE INC's official web site, go to www.apolloreit.com.
ARI Valuation Summary
- In comparison to the median Real Estate stock, ARI's price/earnings ratio is 57.25% lower, now standing at 11.8.
- Over the past 170 months, ARI's price/sales ratio has gone NA NA.
Below are key valuation metrics over time for ARI.
Stock | Date | P/S | P/B | P/E | EV/EBIT |
---|---|---|---|---|---|
ARI | 2023-09-15 | 4.5 | 0.7 | 11.8 | 56.8 |
ARI | 2023-09-14 | 4.5 | 0.7 | 11.6 | 56.7 |
ARI | 2023-09-13 | 4.3 | 0.7 | 11.2 | 56.4 |
ARI | 2023-09-12 | 4.4 | 0.7 | 11.4 | 56.5 |
ARI | 2023-09-11 | 4.4 | 0.7 | 11.5 | 56.6 |
ARI | 2023-09-08 | 4.4 | 0.7 | 11.4 | 56.5 |
ARI Growth Metrics
- Its year over year revenue growth rate is now at 0.86%.
- Its 4 year net cashflow from operations growth rate is now at 106.34%.
- The 2 year price growth rate now stands at 66.42%.

The table below shows ARI's growth in key financial areas (numbers in millions of US dollars).
Date | Revenue | Operating Cash Flow | Net Income to Common Stock |
---|---|---|---|
2022-12-31 | 303.64 | 267.705 | 252.96 |
2022-09-30 | 287.354 | 259.628 | 294.044 |
2022-06-30 | 277.698 | 177.884 | 171.348 |
2022-03-31 | 277.54 | 205.133 | 167.771 |
2021-12-31 | 284.51 | 199.383 | 210.551 |
2021-09-30 | 278.351 | 215.891 | 209.817 |
ARI's Quality Factors
The “Quality” component of the POWR Ratings focuses on 31 different factors of a companies fundamentals and operational strength. Here are some key insights as we drill into the specifics of these quality attributes.- ARI has a Quality Grade of C, ranking ahead of 71.64% of graded US stocks.
- ARI's asset turnover comes in at 0.037 -- ranking 311th of 442 Trading stocks.
- FR, NXRT, and VNO are the stocks whose asset turnover ratios are most correlated with ARI.
The table below shows ARI's key quality metrics over time.
Period | Asset Turnover | Gross Margin | ROIC |
---|---|---|---|
2021-09-30 | 0.037 | 1 | 0.018 |
2021-06-30 | 0.039 | 1 | 0.018 |
2021-03-31 | 0.039 | 1 | 0.018 |
2020-12-31 | 0.040 | 1 | 0.002 |
2020-09-30 | 0.042 | 1 | 0.005 |
2020-06-30 | 0.046 | 1 | 0.003 |
ARI Price Target
For more insight on analysts targets of ARI, see our ARI price target page. And for a list of of all stocks sorted by upside potential based on analyst target price, see our Top Price Target page.
Average Price Target | $15.67 | Average Broker Recommendation | 2 (Hold) |
Apollo Commercial Real Estate Finance, Inc (ARI) Company Bio
Apollo Commercial Real Estate Finance, Inc. operates as a real estate investment trust that primarily originates, acquires, invests in, and manages commercial first mortgage loans, subordinate financings, commercial mortgage-backed securities, and other commercial real estate-related debt investments in the United States. The company was founded in 2009 and is based in New York, New York.
Latest ARI News From Around the Web
Below are the latest news stories about APOLLO COMMERCIAL REAL ESTATE FINANCE INC that investors may wish to consider to help them evaluate ARI as an investment opportunity.
Apollo Commercial Real Estate Finance, Inc. Declares Quarterly Common Stock DividendNEW YORK, Sept. 12, 2023 (GLOBE NEWSWIRE) -- Apollo Commercial Real Estate Finance, Inc. (the “Company”) (NYSE:ARI) today announced the Board of Directors declared a dividend of $0.35 per share of common stock, which is payable on October 13, 2023 to common stockholders of record on September 29, 2023. About Apollo Commercial Real Estate Finance, Inc. Apollo Commercial Real Estate Finance, Inc. (NYSE: ARI) is a real estate investment trust that primarily originates, acquires, invests in and mana |
Shareholders in Apollo Commercial Real Estate Finance (NYSE:ARI) are in the red if they invested five years agoIn order to justify the effort of selecting individual stocks, it's worth striving to beat the returns from a market... |
15 Highest Yielding Dividend Stocks You Can Buy TodayIn this article, we discuss 15 highest yielding dividend stocks you can buy today. You can skip our detailed analysis of dividend stocks and high yields, and go directly to read 5 Highest Yielding Dividend Stocks You Can Buy Today. The performance of high-yielding stocks can vary significantly over time and is influenced by various […] |
11 Most Undervalued REIT Stocks to Buy According to Hedge FundsIn this piece, we will take a look at the 11 most undervalued REIT stocks to buy according to hedge funds. If you want to take a look at the top five stocks in this list and skip our introduction to the real estate industry then take a look at 5 Most Undervalued REIT Stocks […] |
REITs Beating And Meeting FFO Estimates Yet Missing On Revenues: Is This A Sign Of Things To Come?Newer investors sometimes struggle to understand the difference between earnings per share (EPS), funds from operations (FFO) and revenue in the context of real estate investment trusts (REITs). Revenue represents the total amount of money that a company generates from sales, rents or other sources. Earnings per share refers to the company's profitability after deducting all expenses from its revenue. Higher revenue does not guarantee significant profitability if expenses are also high. Converse |
ARI Price Returns
1-mo | 0.29% |
3-mo | -0.20% |
6-mo | 21.68% |
1-year | 12.67% |
3-year | 66.40% |
5-year | -3.11% |
YTD | 3.36% |
2022 | -7.12% |
2021 | 29.66% |
2020 | -29.03% |
2019 | 21.15% |
2018 | -0.03% |
ARI Dividends
Ex-Dividend Date | Type | Payout Amount | Change | ||||||
---|---|---|---|---|---|---|---|---|---|
Loading, please wait... |
Continue Researching ARI
Want to see what other sources are saying about Apollo Commercial Real Estate Finance Inc's financials and stock price? Try the links below:Apollo Commercial Real Estate Finance Inc (ARI) Stock Price | Nasdaq
Apollo Commercial Real Estate Finance Inc (ARI) Stock Quote, History and News - Yahoo Finance
Apollo Commercial Real Estate Finance Inc (ARI) Stock Price and Basic Information | MarketWatch
Loading social stream, please wait...