Archrock, Inc. (AROC): Price and Financial Metrics
AROC Price/Volume Stats
Current price | $18.51 | 52-week high | $19.42 |
Prev. close | $18.72 | 52-week low | $8.78 |
Day low | $18.46 | Volume | 1,148,800 |
Day high | $18.89 | Avg. volume | 1,284,264 |
50-day MA | $16.82 | Dividend yield | 3.53% |
200-day MA | $13.64 | Market Cap | 2.89B |
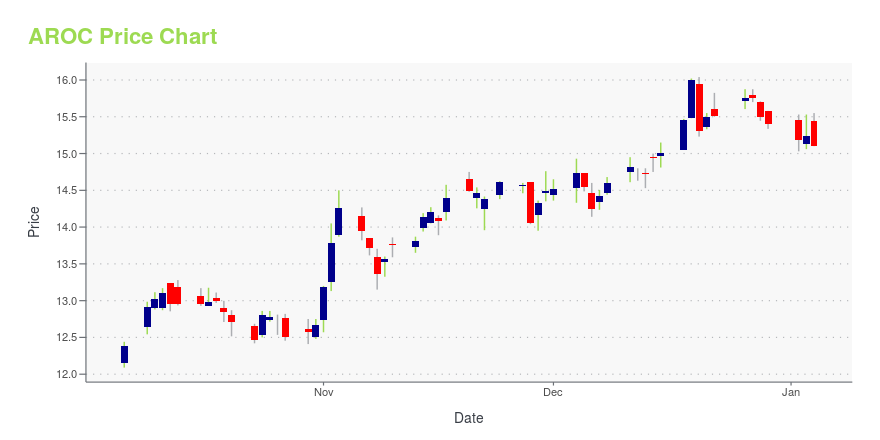
AROC Stock Price Chart Interactive Chart >
AROC POWR Grades
- AROC scores best on the Growth dimension, with a Growth rank ahead of 96.95% of US stocks.
- The strongest trend for AROC is in Stability, which has been heading down over the past 26 weeks.
- AROC ranks lowest in Value; there it ranks in the 8th percentile.
AROC Stock Summary
- Of note is the ratio of ARCHROCK INC's sales and general administrative expense to its total operating expenses; only 19.91% of US stocks have a lower such ratio.
- The ratio of debt to operating expenses for ARCHROCK INC is higher than it is for about 84.83% of US stocks.
- In terms of twelve month growth in earnings before interest and taxes, ARCHROCK INC is reporting a growth rate of 44.71%; that's higher than 80.76% of US stocks.
- If you're looking for stocks that are quantitatively similar to ARCHROCK INC, a group of peers worth examining would be PNM, SKT, PANL, DO, and RLJ.
- AROC's SEC filings can be seen here. And to visit ARCHROCK INC's official web site, go to www.archrock.com.
AROC Valuation Summary
- In comparison to the median Energy stock, AROC's price/sales ratio is 85.19% higher, now standing at 2.5.
- AROC's price/earnings ratio has moved down 909.6 over the prior 197 months.
Below are key valuation metrics over time for AROC.
Stock | Date | P/S | P/B | P/E | EV/EBIT |
---|---|---|---|---|---|
AROC | 2023-12-28 | 2.5 | 2.8 | 29.3 | 18.2 |
AROC | 2023-12-27 | 2.6 | 2.9 | 29.8 | 18.4 |
AROC | 2023-12-26 | 2.6 | 2.9 | 29.8 | 18.4 |
AROC | 2023-12-22 | 2.5 | 2.8 | 29.4 | 18.2 |
AROC | 2023-12-21 | 2.5 | 2.8 | 29.3 | 18.2 |
AROC | 2023-12-20 | 2.5 | 2.8 | 29.0 | 18.1 |
AROC Growth Metrics
- Its 5 year cash and equivalents growth rate is now at -70.2%.
- The 2 year cash and equivalents growth rate now stands at -60.82%.
- Its 3 year net income to common stockholders growth rate is now at -41.88%.
The table below shows AROC's growth in key financial areas (numbers in millions of US dollars).
Date | Revenue | Operating Cash Flow | Net Income to Common Stock |
---|---|---|---|
2022-12-31 | 845.568 | 203.45 | 44.296 |
2022-09-30 | 821.946 | 195.007 | 39.83 |
2022-06-30 | 803.444 | 200.307 | 33.763 |
2022-03-31 | 783.231 | 236.417 | 25.769 |
2021-12-31 | 781.461 | 237.4 | 28.217 |
2021-09-30 | 785.538 | 277.169 | 27.016 |
AROC's Quality Factors
The “Quality” component of the POWR Ratings focuses on 31 different factors of a companies fundamentals and operational strength. Here are some key insights as we drill into the specifics of these quality attributes.- AROC has a Quality Grade of B, ranking ahead of 90.07% of graded US stocks.
- AROC's asset turnover comes in at 0.291 -- ranking 28th of 105 Utilities stocks.
- NJR, AGR, and UGI are the stocks whose asset turnover ratios are most correlated with AROC.
The table below shows AROC's key quality metrics over time.
Period | Asset Turnover | Gross Margin | ROIC |
---|---|---|---|
2021-09-30 | 0.291 | 0.550 | 0.036 |
2021-06-30 | 0.288 | 0.563 | 0.037 |
2021-03-31 | 0.291 | 0.573 | 0.025 |
2020-12-31 | 0.302 | 0.569 | 0.004 |
2020-09-30 | 0.309 | 0.563 | 0.005 |
2020-06-30 | 0.316 | 0.552 | 0.005 |
Archrock, Inc. (AROC) Company Bio
Archrock, Inc. provides natural gas contract compression services to customers in the oil and natural gas industry in the United States. The company was formerly known as Exterran Holdings, Inc. and changed its name to Archrock, Inc. in November 2015. The company was founded in 1990 and is based in Houston, Texas.
Latest AROC News From Around the Web
Below are the latest news stories about ARCHROCK INC that investors may wish to consider to help them evaluate AROC as an investment opportunity.
Williams (WMB) to Buy Gas Storage Portfolio for $1.95 BillionWilliams (WMB) is set to acquire a $1.95B natural gas assets portfolio in the Gulf Coast, establishing a strong hold over the rapidly evolving energy landscape. |
Shell (SHEL) Secures Natural Gas Production License in VenezuelaShell (SHEL) and Trinidad and Tobago's National Gas Company secure a 30-year license for the Dragon project, boosting economic prospects and LNG production. |
Marathon (MPC), Performance Shipping Ink Time Charter DealMarathon (MPC) secures a lucrative two-year time charter contract with Performance Shipping, ensuring reliable transportation, potentially advantageous rates and strategic partnership. |
Petrobras (PBR) Starts Drilling Well in Equatorial MarginPetrobras (PBR) begins exploration in Brazil's Equatorial Margin, drilling Pitu Oeste well for oil and gas, investing $3.1 billion by 2028. |
Archrock, Inc.'s (NYSE:AROC) Share Price Matching Investor OpinionArchrock, Inc.'s ( NYSE:AROC ) price-to-earnings (or "P/E") ratio of 29x might make it look like a strong sell right... |
AROC Price Returns
1-mo | 6.69% |
3-mo | 16.87% |
6-mo | 54.96% |
1-year | 104.31% |
3-year | 123.91% |
5-year | 151.84% |
YTD | 21.43% |
2023 | 80.96% |
2022 | 28.83% |
2021 | -7.83% |
2020 | -5.58% |
2019 | 41.84% |
AROC Dividends
Ex-Dividend Date | Type | Payout Amount | Change | ||||||
---|---|---|---|---|---|---|---|---|---|
Loading, please wait... |
Continue Researching AROC
Want to do more research on Archrock Inc's stock and its price? Try the links below:Archrock Inc (AROC) Stock Price | Nasdaq
Archrock Inc (AROC) Stock Quote, History and News - Yahoo Finance
Archrock Inc (AROC) Stock Price and Basic Information | MarketWatch
Loading social stream, please wait...