
Arrow Financial Corporation (AROW): Price and Financial Metrics
AROW Price/Volume Stats
| Current price | $32.17 | 52-week high | $32.92 |
| Prev. close | $32.41 | 52-week low | $16.65 |
| Day low | $31.30 | Volume | 56,200 |
| Day high | $32.92 | Avg. volume | 43,558 |
| 50-day MA | $26.20 | Dividend yield | 3.51% |
| 200-day MA | $24.73 | Market Cap | 537.17M |
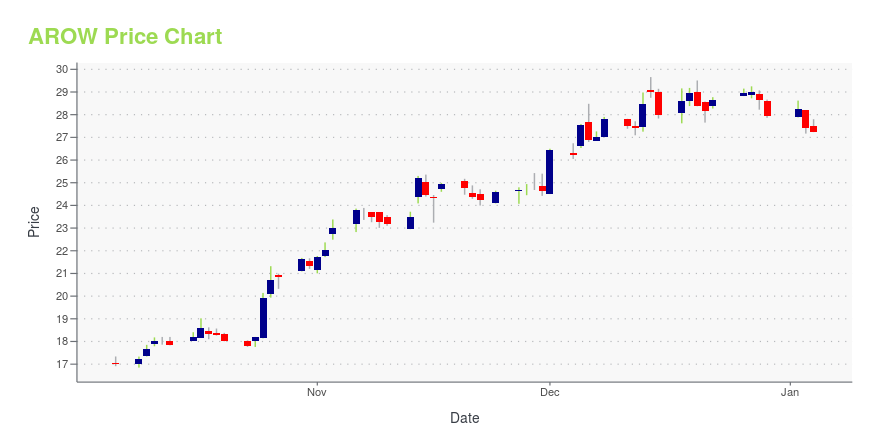
AROW Stock Price Chart Interactive Chart >
Arrow Financial Corporation (AROW) Company Bio
Arrow Financial offers commercial and consumer banking and financial products, as well as retirement planning, trust, and estate administration services for individuals; and pension, profit-sharing, and employee benefit plan administration for corporations. The company was founded in 1851 and is based in Glens Falls, New York.
Latest AROW News From Around the Web
Below are the latest news stories about ARROW FINANCIAL CORP that investors may wish to consider to help them evaluate AROW as an investment opportunity.
Arrow Financial's (NASDAQ:AROW) Dividend Will Be $0.27Arrow Financial Corporation ( NASDAQ:AROW ) has announced that it will pay a dividend of $0.27 per share on the 15th of... |
Insider Buying: Director Colin Read Acquires 15,000 Shares of Arrow Financial CorpOn October 30, 2023, Colin Read, a director at Arrow Financial Corp (NASDAQ:AROW), made a significant insider purchase of 15,000 shares of the company's stock. |
Why Arrow Financial (AROW) Might be Well Poised for a SurgeArrow Financial (AROW) shares have started gaining and might continue moving higher in the near term, as indicated by solid earnings estimate revisions. |
Why Arrow Financial Stock Is Shooting Higher This WeekArrow Financial (NASDAQ: AROW) stock is posting strong gains this week. The company's share price was up 14.9% from last week's market close before the market opened this Friday, according to data from S&P Global Market Intelligence. On Oct. 24, Arrow Financial published third-quarter results that beat the company's expectations. |
Arrow Declares December 2023 Cash Dividend; Announces Resumption of Dividend Reinvestment Plan and Expansion of Its Stock Repurchase ProgramThe Board of Directors of Arrow Financial Corporation (NasdaqGS® - AROW) on October 25, 2023, declared a quarterly cash dividend of $0.27 per share payable December 15, 2023 to shareholders of record on December 1, 2023. This dividend marks the 42nd consecutive quarterly cash dividend declared by Arrow. |
AROW Price Returns
| 1-mo | 26.55% |
| 3-mo | 41.70% |
| 6-mo | 20.82% |
| 1-year | 66.73% |
| 3-year | 0.36% |
| 5-year | 15.11% |
| YTD | 17.75% |
| 2023 | -13.42% |
| 2022 | -0.67% |
| 2021 | 21.32% |
| 2020 | -18.07% |
| 2019 | 21.73% |
AROW Dividends
| Ex-Dividend Date | Type | Payout Amount | Change | ||||||
|---|---|---|---|---|---|---|---|---|---|
| Loading, please wait... | |||||||||
Continue Researching AROW
Want to see what other sources are saying about Arrow Financial Corp's financials and stock price? Try the links below:Arrow Financial Corp (AROW) Stock Price | Nasdaq
Arrow Financial Corp (AROW) Stock Quote, History and News - Yahoo Finance
Arrow Financial Corp (AROW) Stock Price and Basic Information | MarketWatch
Loading social stream, please wait...