Associated Banc-Corp (ASB): Price and Financial Metrics
ASB Price/Volume Stats
Current price | $15.41 | 52-week high | $25.50 |
Prev. close | $15.56 | 52-week low | $14.47 |
Day low | $15.20 | Volume | 1,235,100 |
Day high | $15.66 | Avg. volume | 1,862,002 |
50-day MA | $16.87 | Dividend yield | 5.4% |
200-day MA | $20.99 | Market Cap | 2.33B |
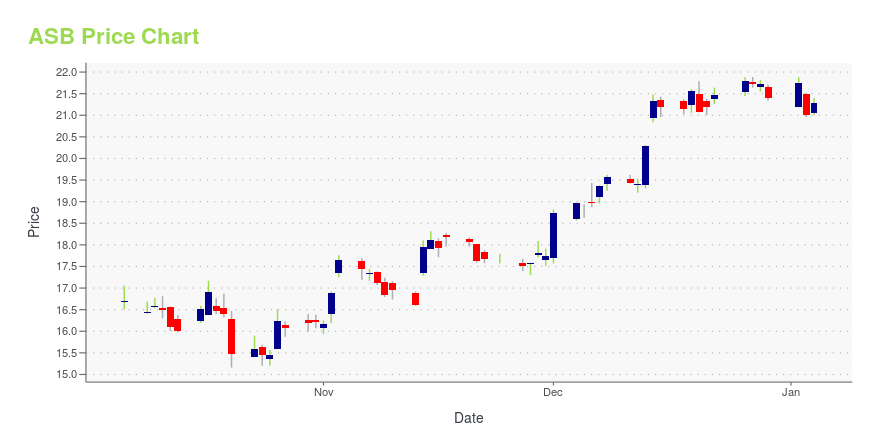
ASB Stock Price Chart Interactive Chart >
ASB POWR Grades
- Value is the dimension where ASB ranks best; there it ranks ahead of 82.9% of US stocks.
- ASB's strongest trending metric is Stability; it's been moving down over the last 179 days.
- ASB ranks lowest in Quality; there it ranks in the 11th percentile.
ASB Stock Summary
- ASB's went public 37.42 years ago, making it older than 93.61% of listed US stocks we're tracking.
- With a year-over-year growth in debt of 163.22%, ASSOCIATED BANC-CORP's debt growth rate surpasses 91.64% of about US stocks.
- Shareholder yield, a measure of how much is returned to shareholders via dividends and share repurchases, for ASB comes in at -146.88% -- higher than that of only 3.77% of stocks in our set.
- Stocks with similar financial metrics, market capitalization, and price volatility to ASSOCIATED BANC-CORP are FMBH, BRKL, RBB, CZWI, and GBCI.
- ASB's SEC filings can be seen here. And to visit ASSOCIATED BANC-CORP's official web site, go to www.associatedbank.com.
ASB Valuation Summary
- ASB's EV/EBIT ratio is 14.5; this is 34.26% higher than that of the median Financial Services stock.
- Over the past 243 months, ASB's price/sales ratio has gone down 2.1.
Below are key valuation metrics over time for ASB.
Stock | Date | P/S | P/B | P/E | EV/EBIT |
---|---|---|---|---|---|
ASB | 2023-05-19 | 1.8 | 0.6 | 6.0 | 14.5 |
ASB | 2023-05-18 | 1.9 | 0.6 | 6.1 | 14.6 |
ASB | 2023-05-17 | 1.9 | 0.6 | 6.1 | 14.6 |
ASB | 2023-05-16 | 1.7 | 0.6 | 5.7 | 14.3 |
ASB | 2023-05-15 | 1.8 | 0.6 | 5.9 | 14.5 |
ASB | 2023-05-12 | 1.8 | 0.6 | 5.8 | 14.4 |
ASB Growth Metrics
- Its 5 year net cashflow from operations growth rate is now at -26.86%.
- Its 2 year revenue growth rate is now at -2.6%.
- The 2 year price growth rate now stands at 52.78%.

The table below shows ASB's growth in key financial areas (numbers in millions of US dollars).
Date | Revenue | Operating Cash Flow | Net Income to Common Stock |
---|---|---|---|
2022-12-31 | 1,206.693 | 846.566 | 354.622 |
2022-09-30 | 1,150.296 | 887.74 | 322.739 |
2022-06-30 | 1,121.829 | 788.388 | 313.994 |
2022-03-31 | 1,118.185 | 617.902 | 316.176 |
2021-12-31 | 1,146.23 | 529.551 | 333.883 |
2021-09-30 | 1,128.682 | 491.101 | 321.675 |
ASB's Quality Factors
The “Quality” component of the POWR Ratings focuses on 31 different factors of a companies fundamentals and operational strength. Here are some key insights as we drill into the specifics of these quality attributes.- ASB has a Quality Grade of C, ranking ahead of 35.08% of graded US stocks.
- ASB's asset turnover comes in at 0.033 -- ranking 322nd of 428 Banking stocks.
- NWFL, FBNC, and FXNC are the stocks whose asset turnover ratios are most correlated with ASB.
The table below shows ASB's key quality metrics over time.
Period | Asset Turnover | Gross Margin | ROIC |
---|---|---|---|
2021-09-30 | 0.033 | 1 | 0.013 |
2021-06-30 | 0.031 | 1 | 0.009 |
2021-03-31 | 0.033 | 1 | 0.011 |
2020-12-31 | 0.032 | 1 | 0.009 |
2020-09-30 | 0.033 | 1 | 0.009 |
2020-06-30 | 0.037 | 1 | 0.013 |
ASB Price Target
For more insight on analysts targets of ASB, see our ASB price target page. And for a list of of all stocks sorted by upside potential based on analyst target price, see our Top Price Target page.
Average Price Target | $22.06 | Average Broker Recommendation | 2 (Hold) |
Associated Banc-Corp (ASB) Company Bio
Associated Banc Corporation provides various banking and nonbanking products and services to individuals and businesses in Wisconsin, Illinois, and Minnesota. The company was founded in 1964 and is based in Green Bay, Wisconsin.
Latest ASB News From Around the Web
Below are the latest news stories about ASSOCIATED BANC-CORP that investors may wish to consider to help them evaluate ASB as an investment opportunity.
Columbia Banking Stock (COLB) to Watch on 5.8% Dividend YieldAmid the regional bank crisis, investors can watch the Columbia Banking (COLB) stock for its hefty dividend yield. |
Seeking More Than 6% Dividend Yield? Watch for Zions (ZION)Investors must keep solid dividend-yielding stocks like Zions (ZION) on the radar amid the challenging macroeconomic environment. |
Huntington (HBAN) Stock May Be Retained for Dividend YieldInvestors may retain solid dividend-yielding stocks like Huntington (HBAN) in their portfolios amid challenging macroeconomic environment. |
Ares Capital (ARCC) Stock in Focus on 10.5% Dividend YieldInvestors must keep solid dividend-yielding stocks like Ares Capital (ARCC) on the radar amid the challenging macroeconomic environment. |
Should You Watch Associated Banc-Corp (ASB) for Solid Dividend?Amid the expectations of recession, it becomes difficult of investors to generate robust returns. So, they should keep solid dividend-yielding stocks like Associated Banc-Corp (ASB) on the radar. |
ASB Price Returns
1-mo | -13.57% |
3-mo | -33.83% |
6-mo | -36.59% |
1-year | N/A |
3-year | 22.12% |
5-year | -33.62% |
YTD | -32.66% |
2022 | 5.98% |
2021 | 37.25% |
2020 | -18.93% |
2019 | 15.09% |
2018 | -20.16% |
ASB Dividends
Ex-Dividend Date | Type | Payout Amount | Change | ||||||
---|---|---|---|---|---|---|---|---|---|
Loading, please wait... |
Continue Researching ASB
Want to see what other sources are saying about Associated Banc-Corp's financials and stock price? Try the links below:Associated Banc-Corp (ASB) Stock Price | Nasdaq
Associated Banc-Corp (ASB) Stock Quote, History and News - Yahoo Finance
Associated Banc-Corp (ASB) Stock Price and Basic Information | MarketWatch
Loading social stream, please wait...