
Ashland Global Holdings Inc. (ASH): Price and Financial Metrics
ASH Price/Volume Stats
| Current price | $96.19 | 52-week high | $102.50 |
| Prev. close | $94.52 | 52-week low | $70.82 |
| Day low | $95.09 | Volume | 193,529 |
| Day high | $97.01 | Avg. volume | 402,514 |
| 50-day MA | $96.89 | Dividend yield | 1.66% |
| 200-day MA | $89.52 | Market Cap | 4.82B |
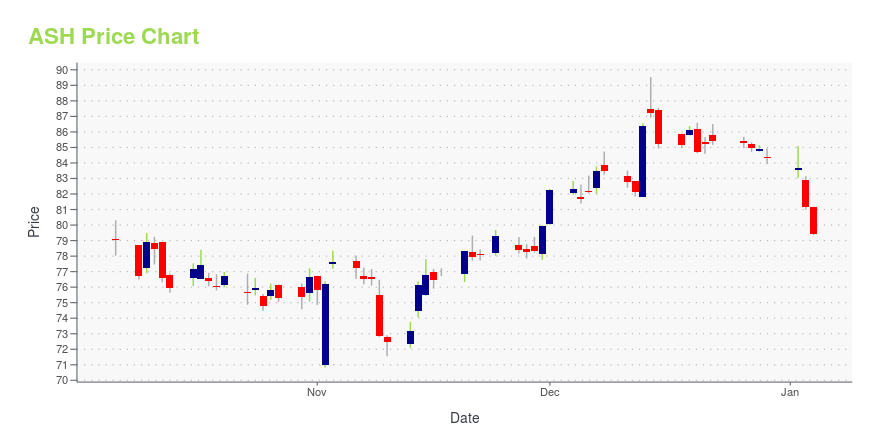
ASH Stock Price Chart Interactive Chart >
Ashland Global Holdings Inc. (ASH) Company Bio
Ashland Global Holdings Inc. provides specialty chemical solutions to customers in a wide range of consumer and industrial markets, including architectural coatings, automotive, construction, energy, food and beverage, personal care and pharmaceutical. The company was founded in 1924 and is based in Covington, Kentucky.
Latest ASH News From Around the Web
Below are the latest news stories about ASHLAND INC that investors may wish to consider to help them evaluate ASH as an investment opportunity.
The past year for Ashland (NYSE:ASH) investors has not been profitableAshland Inc. ( NYSE:ASH ) shareholders should be happy to see the share price up 14% in the last month. But that... |
Ashland’s Carolmarie Brown tapped for top Women in Business by Delaware Today and the Delaware Business TimesThe yearly award singles out women whose contributions to the Delaware business community are both unique and impactful; the depth and breadth of Carolmarie Brown’s experience at Ashland, DuPont and more underscore the powerful impact women can have on business Carolmarie Brown6293_pp_RGB FINAL WILMINGTON, Del., Dec. 04, 2023 (GLOBE NEWSWIRE) -- As a female business executive, strategist, marketing and communications expert and philanthropist, Carolmarie Brown understands how to shape the brand |
Ashland announces validation of comprehensive science-based greenhouse gas emissions reductions targetsWILMINGTON, Del., Nov. 30, 2023 (GLOBE NEWSWIRE) -- The Science Based Targets initiative (SBTi) has validated the science-based greenhouse gas (GHG) emissions reductions targets submitted by Ashland Inc. (NYSE: ASH) as conforming with the SBTi Criteria and Recommendations. The company has joined more than 6,500 businesses who have committed to the SBTi to reduce emissions in line with climate science. Ashland has set near-term science-based targets across scopes one, two, and three in line with |
Ashland Inc. (NYSE:ASH) Stock Goes Ex-Dividend In Just Three DaysIt looks like Ashland Inc. ( NYSE:ASH ) is about to go ex-dividend in the next three days. The ex-dividend date is... |
Billionaire Leon Cooperman’s Long-Term Stock PicksIn this piece, we will take a look at Leon Cooperman’s long term stock picks. If you want to skip our introduction to the billionaire hedge fund investor and the latest stock market news, then take a look at Billionaire Leon Cooperman’s Long-Term Stock Picks: Top 5 Stocks. Leon Cooperman is one of the most […] |
ASH Price Returns
| 1-mo | 1.38% |
| 3-mo | 0.54% |
| 6-mo | 20.50% |
| 1-year | 7.12% |
| 3-year | 16.58% |
| 5-year | 29.97% |
| YTD | 15.03% |
| 2023 | -20.24% |
| 2022 | 1.14% |
| 2021 | 37.67% |
| 2020 | 5.05% |
| 2019 | 9.42% |
ASH Dividends
| Ex-Dividend Date | Type | Payout Amount | Change | ||||||
|---|---|---|---|---|---|---|---|---|---|
| Loading, please wait... | |||||||||
Continue Researching ASH
Here are a few links from around the web to help you further your research on Ashland Global Holdings Inc's stock as an investment opportunity:Ashland Global Holdings Inc (ASH) Stock Price | Nasdaq
Ashland Global Holdings Inc (ASH) Stock Quote, History and News - Yahoo Finance
Ashland Global Holdings Inc (ASH) Stock Price and Basic Information | MarketWatch
Loading social stream, please wait...