
Astec Industries, Inc. (ASTE): Price and Financial Metrics
ASTE Price/Volume Stats
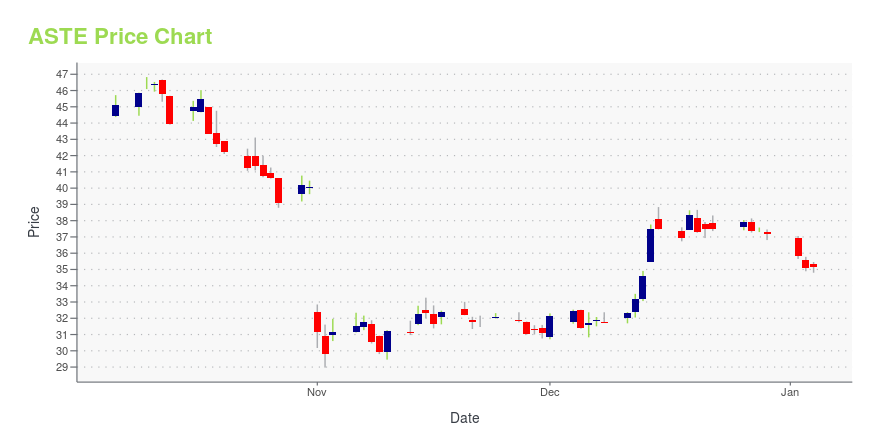
| Current price | $35.24 | 52-week high | $56.33 |
| Prev. close | $34.56 | 52-week low | $28.46 |
| Day low | $34.75 | Volume | 160,200 |
| Day high | $35.55 | Avg. volume | 152,266 |
| 50-day MA | $31.71 | Dividend yield | 1.49% |
| 200-day MA | $35.97 | Market Cap | 802.24M |
ASTE Stock Price Chart Interactive Chart >
Astec Industries, Inc. (ASTE) Company Bio
Astec Industries is a manufacturer of specialized equipment for asphalt road building; aggregate processing; oil, gas and water well drilling; and wood processing. The company was founded in 1972 and is based in Chattanooga, Tennessee.
Latest ASTE News From Around the Web
Below are the latest news stories about ASTEC INDUSTRIES INC that investors may wish to consider to help them evaluate ASTE as an investment opportunity.
Should You Think About Buying Astec Industries, Inc. (NASDAQ:ASTE) Now?While Astec Industries, Inc. ( NASDAQ:ASTE ) might not be the most widely known stock at the moment, it received a lot... |
Sidoti Events, LLC's Virtual December Small-Cap ConferenceNEW YORK, NY / ACCESSWIRE / December 5, 2023 / Sidoti Events, LLC, an affiliate of Sidoti & Company, LLC, has released the presentation schedule and weblinks for its two-day December Small-Cap Conference taking place Wednesday and Thursday, December ... |
Astec Releases Inaugural Corporate Sustainability ReportCHATTANOOGA, Tenn., Dec. 05, 2023 (GLOBE NEWSWIRE) -- Astec Industries, Inc. (NASDAQ: ASTE) announced today the release of its 2023 Corporate Sustainability Report. The report provides details of the company’s environmental, social and governance (ESG) journey. “I am pleased to share our inaugural Corporate Sustainability Report,” said Jaco van der Merwe, President and Chief Executive Officer of Astec. “Guided by our Core Values – Safety, Devotion, Integrity, Respect, and Innovation – we strive |
Billionaire Gabelli’s 10 Stock Picks with Huge Upside PotentialIn this article, we will take a look at billionaire Gabelli’s 10 stock picks with huge upside potential. To skip our analysis of Gabelli’s investment strategy and GAMCO Investor’s previous performance, you can go directly to see the Billionaire Gabelli’s 5 Stock Picks with Huge Upside Potential. Mario Joseph Gabelli is a renowned investor, Founder, […] |
Why Is Astec Industries (ASTE) Up 4.3% Since Last Earnings Report?Astec Industries (ASTE) reported earnings 30 days ago. What's next for the stock? We take a look at earnings estimates for some clues. |
ASTE Price Returns
| 1-mo | 20.03% |
| 3-mo | -17.05% |
| 6-mo | -2.23% |
| 1-year | -25.98% |
| 3-year | -39.25% |
| 5-year | 14.79% |
| YTD | -4.62% |
| 2023 | -7.33% |
| 2022 | -40.44% |
| 2021 | 20.47% |
| 2020 | 39.49% |
| 2019 | 40.91% |
ASTE Dividends
| Ex-Dividend Date | Type | Payout Amount | Change | ||||||
|---|---|---|---|---|---|---|---|---|---|
| Loading, please wait... | |||||||||
Continue Researching ASTE
Want to do more research on Astec Industries Inc's stock and its price? Try the links below:Astec Industries Inc (ASTE) Stock Price | Nasdaq
Astec Industries Inc (ASTE) Stock Quote, History and News - Yahoo Finance
Astec Industries Inc (ASTE) Stock Price and Basic Information | MarketWatch
Loading social stream, please wait...