Avista Corporation (AVA): Price and Financial Metrics
AVA Price/Volume Stats
Current price | $33.83 | 52-week high | $45.28 |
Prev. close | $33.94 | 52-week low | $32.27 |
Day low | $33.66 | Volume | 486,600 |
Day high | $34.05 | Avg. volume | 795,496 |
50-day MA | $35.63 | Dividend yield | 5.42% |
200-day MA | $40.29 | Market Cap | 2.59B |
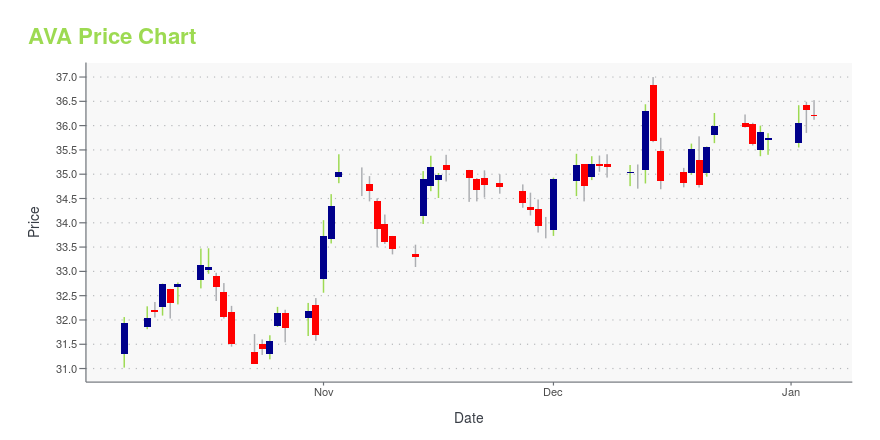
AVA Stock Price Chart Interactive Chart >
AVA POWR Grades
- Growth is the dimension where AVA ranks best; there it ranks ahead of 79.26% of US stocks.
- The strongest trend for AVA is in Momentum, which has been heading down over the past 179 days.
- AVA ranks lowest in Sentiment; there it ranks in the 12th percentile.
AVA Stock Summary
- With a one year PEG ratio of 287.93, AVISTA CORP is expected to have a higher PEG ratio (a measure of how expensive a stock is relative to its expected earnings growth) than 89.87% of US stocks.
- AVISTA CORP's stock had its IPO on November 16, 1987, making it an older stock than 91.13% of US equities in our set.
- The ratio of debt to operating expenses for AVISTA CORP is higher than it is for about 79.59% of US stocks.
- Stocks with similar financial metrics, market capitalization, and price volatility to AVISTA CORP are OGS, GWRS, RGCO, CLH, and BALY.
- Visit AVA's SEC page to see the company's official filings. To visit the company's web site, go to www.avistacorp.com.
AVA Valuation Summary
- In comparison to the median Utilities stock, AVA's EV/EBIT ratio is 2.96% higher, now standing at 20.9.
- AVA's EV/EBIT ratio has moved up 11.6 over the prior 243 months.
Below are key valuation metrics over time for AVA.
Stock | Date | P/S | P/B | P/E | EV/EBIT |
---|---|---|---|---|---|
AVA | 2023-09-14 | 1.5 | 1.1 | 18.4 | 20.9 |
AVA | 2023-09-13 | 1.5 | 1.1 | 18.1 | 20.8 |
AVA | 2023-09-12 | 1.5 | 1.1 | 18.1 | 20.8 |
AVA | 2023-09-11 | 1.5 | 1.1 | 18.1 | 20.7 |
AVA | 2023-09-08 | 1.5 | 1.1 | 17.8 | 20.6 |
AVA | 2023-09-07 | 1.5 | 1.1 | 17.7 | 20.5 |
AVA Growth Metrics
- Its 3 year price growth rate is now at -1.28%.
- Its 5 year net income to common stockholders growth rate is now at -8.53%.
- Its year over year revenue growth rate is now at 10.68%.

The table below shows AVA's growth in key financial areas (numbers in millions of US dollars).
Date | Revenue | Operating Cash Flow | Net Income to Common Stock |
---|---|---|---|
2022-09-30 | 1,631.862 | 248.836 | 128.097 |
2022-06-30 | 1,568.423 | 283.218 | 148.261 |
2022-03-31 | 1,488.112 | 284.1 | 150.882 |
2021-12-31 | 1,438.936 | 267.34 | 147.334 |
2021-09-30 | 1,387.555 | 277.392 | 155.192 |
2021-06-30 | 1,364.194 | 321.179 | 145.702 |
AVA's Quality Factors
The “Quality” component of the POWR Ratings focuses on 31 different factors of a companies fundamentals and operational strength. Here are some key insights as we drill into the specifics of these quality attributes.- AVA has a Quality Grade of C, ranking ahead of 30.23% of graded US stocks.
- AVA's asset turnover comes in at 0.212 -- ranking 55th of 105 Utilities stocks.
- AQN, MSEX, and SJW are the stocks whose asset turnover ratios are most correlated with AVA.
The table below shows AVA's key quality metrics over time.
Period | Asset Turnover | Gross Margin | ROIC |
---|---|---|---|
2021-09-30 | 0.212 | 0.597 | 0.034 |
2021-06-30 | 0.212 | 0.609 | 0.034 |
2021-03-31 | 0.212 | 0.620 | 0.033 |
2020-12-31 | 0.210 | 0.618 | 0.031 |
2020-09-30 | 0.210 | 0.618 | 0.030 |
2020-06-30 | 0.215 | 0.607 | 0.030 |
AVA Price Target
For more insight on analysts targets of AVA, see our AVA price target page. And for a list of of all stocks sorted by upside potential based on analyst target price, see our Top Price Target page.
Average Price Target | $41.50 | Average Broker Recommendation | 2.1 (Hold) |
Avista Corporation (AVA) Company Bio
Avista Corporation generates, transmits, and distributes electricity; and distributes natural gas in the United States and Canada. The company was founded in 1889 and is based in Spokane, Washington.
Latest AVA News From Around the Web
Below are the latest news stories about AVISTA CORP that investors may wish to consider to help them evaluate AVA as an investment opportunity.
With 81% ownership of the shares, Avista Corporation (NYSE:AVA) is heavily dominated by institutional ownersKey Insights Given the large stake in the stock by institutions, Avista's stock price might be vulnerable to their... |
Avista Corp. Names New President and Announces Senior Leadership ChangesHeather Rosentrater President and Chief Operating Officer Bryan Cox Senior Vice President, Safety & Chief People Officer SPOKANE, Wash., Sept. 07, 2023 (GLOBE NEWSWIRE) -- Avista Corp. (NYSE: AVA) announced that Senior Vice President and Chief Operating Officer Heather Rosentrater will become President and COO, making her the first female President in the company’s 134 year history. Dennis Vermillion will remain Avista’s Chief Executive Officer. The changes will go into effect on Oct. 1, 2023. A |
Avista (AVA): A Hidden Gem in the Market? An In-Depth Analysis of Its Modest UndervaluationUnveiling the True Value of Avista Corp (AVA) Through Comprehensive Financial Analysis |
The Utilities Selloff Has Gotten Out of Hand. This One Stock Is Selling at an ‘Absurd’ Price.In a sector bursting with bargains, Avista—down more than 25% this year—is particularly cheap. It trades for about 13.7 times earnings, its lowest multiple in more than 10 years. |
Avista issues request for proposals for renewable or responsibly produced natural gasRNG/RSG sought to meet carbon reduction requirements and goals.SPOKANE, Wash., Sept. 06, 2023 (GLOBE NEWSWIRE) -- Avista, through a request for proposal (RFP), is seeking to secure renewable natural gas (RNG) or responsibly sourced gas (RSG) resources for its customers over the long term. RNG is derived from organic waste streams that would otherwise release methane to the environment as they decompose. These sources include, for example, landfills, wastewater treatment plants, food waste and da |
AVA Price Returns
1-mo | 1.50% |
3-mo | -12.23% |
6-mo | -17.70% |
1-year | -14.34% |
3-year | 13.61% |
5-year | -17.88% |
YTD | -20.89% |
2022 | 8.79% |
2021 | 10.28% |
2020 | -13.10% |
2019 | 17.27% |
2018 | -15.06% |
AVA Dividends
Ex-Dividend Date | Type | Payout Amount | Change | ||||||
---|---|---|---|---|---|---|---|---|---|
Loading, please wait... |
Continue Researching AVA
Here are a few links from around the web to help you further your research on Avista Corp's stock as an investment opportunity:Avista Corp (AVA) Stock Price | Nasdaq
Avista Corp (AVA) Stock Quote, History and News - Yahoo Finance
Avista Corp (AVA) Stock Price and Basic Information | MarketWatch
Loading social stream, please wait...