Avient Corporation (AVNT): Price and Financial Metrics
GET POWR RATINGS... FREE!
AVNT POWR Grades
- Value is the dimension where AVNT ranks best; there it ranks ahead of 72.79% of US stocks.
- AVNT's strongest trending metric is Growth; it's been moving down over the last 179 days.
- AVNT's current lowest rank is in the Growth metric (where it is better than 19.13% of US stocks).
AVNT Stock Summary
- Of note is the ratio of AVIENT CORP's sales and general administrative expense to its total operating expenses; 86.96% of US stocks have a lower such ratio.
- With a year-over-year growth in debt of 63.31%, AVIENT CORP's debt growth rate surpasses 83.79% of about US stocks.
- AVIENT CORP's shareholder yield -- a measure of how much capital is returned to stockholders via dividends and buybacks -- is -31.75%, greater than the shareholder yield of just 13.79% of stocks in our set.
- If you're looking for stocks that are quantitatively similar to AVIENT CORP, a group of peers worth examining would be REYN, MTW, BLD, NPO, and SIRE.
- Visit AVNT's SEC page to see the company's official filings. To visit the company's web site, go to www.polyone.com.
AVNT Valuation Summary
- In comparison to the median Basic Materials stock, AVNT's price/sales ratio is 38.46% lower, now standing at 0.8.
- Over the past 243 months, AVNT's price/sales ratio has gone up 0.7.
Below are key valuation metrics over time for AVNT.
Stock | Date | P/S | P/B | P/E | EV/EBIT |
---|---|---|---|---|---|
AVNT | 2023-01-27 | 0.8 | 2.1 | 19.2 | 17.7 |
AVNT | 2023-01-26 | 0.8 | 2.1 | 19.1 | 17.6 |
AVNT | 2023-01-25 | 0.8 | 2.1 | 18.9 | 17.5 |
AVNT | 2023-01-24 | 0.8 | 2.1 | 18.9 | 17.5 |
AVNT | 2023-01-23 | 0.8 | 2.1 | 19.0 | 17.5 |
AVNT | 2023-01-20 | 0.8 | 2.0 | 18.6 | 17.3 |
AVNT Growth Metrics
- Its 5 year cash and equivalents growth rate is now at 711.79%.
- Its year over year net cashflow from operations growth rate is now at 4.66%.
- Its 2 year net income to common stockholders growth rate is now at -59.59%.

The table below shows AVNT's growth in key financial areas (numbers in millions of US dollars).
Date | Revenue | Operating Cash Flow | Net Income to Common Stock |
---|---|---|---|
2022-09-30 | 4,621 | 347.7 | 188.4 |
2022-06-30 | 5,017.5 | 272.4 | 251.6 |
2022-03-31 | 4,950.3 | 249.1 | 235.7 |
2021-12-31 | 4,818.8 | 233.8 | 230.8 |
2021-09-30 | 4,614.3 | 262.9 | 275.3 |
2021-06-30 | 4,319 | 213.7 | 224.1 |
AVNT's Quality Factors
The “Quality” component of the POWR Ratings focuses on 31 different factors of a companies fundamentals and operational strength. Here are some key insights as we drill into the specifics of these quality attributes.- AVNT has a Quality Grade of C, ranking ahead of 26.18% of graded US stocks.
- AVNT's asset turnover comes in at 0.93 -- ranking 18th of 89 Chemicals stocks.
- PPG, ICL, and LYB are the stocks whose asset turnover ratios are most correlated with AVNT.
The table below shows AVNT's key quality metrics over time.
Period | Asset Turnover | Gross Margin | ROIC |
---|---|---|---|
2021-09-30 | 0.930 | 0.238 | 0.122 |
2021-06-30 | 0.884 | 0.244 | 0.109 |
2021-03-31 | 0.785 | 0.248 | 0.095 |
2020-12-31 | 0.734 | 0.242 | 0.080 |
2020-09-30 | 0.723 | 0.236 | 0.268 |
2020-06-30 | 0.751 | 0.237 | 0.300 |
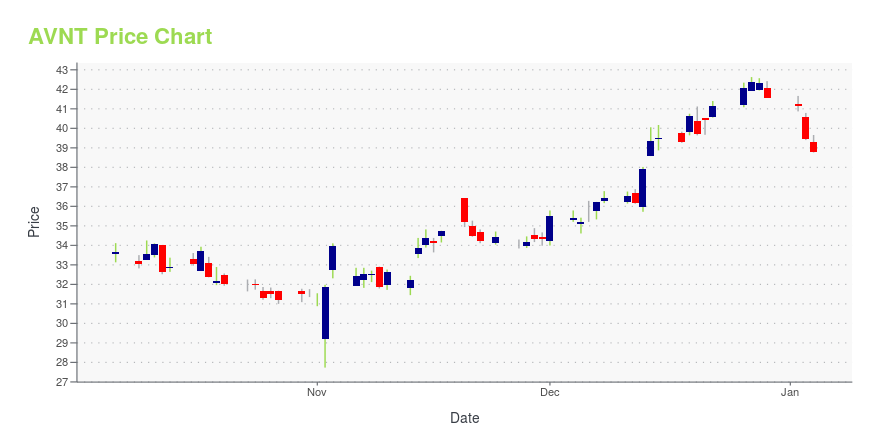
AVNT Stock Price Chart Interactive Chart >
AVNT Price/Volume Stats
Current price | $42.20 | 52-week high | $55.44 |
Prev. close | $41.15 | 52-week low | $27.65 |
Day low | $41.58 | Volume | 64,030 |
Day high | $42.20 | Avg. volume | 430,762 |
50-day MA | $35.89 | Dividend yield | 2.41% |
200-day MA | $39.92 | Market Cap | 3.84B |
Avient Corporation (AVNT) Company Bio
Avient Corporation provides specialized polymer materials, services, and solutions in the United States, Canada, Mexico, Europe, South America, and Asia. It operates in three segments: Color, Additives and Inks; Specialty Engineered Materials; and Distribution. The Color, Additives and Inks segment offers specialized color and additive concentrates in solid and liquid form for thermoplastics; dispersions for thermosets; and specialty inks, plastisols, and vinyl slush molding solutions. The Specialty Engineered Materials segment provides specialty polymer formulations, services, and solutions for designers, assemblers, and processors of thermoplastic materials; and long glass and carbon fiber technology, and thermoset and thermoplastic composites. The Distribution segment distributes approximately 4,000 grades of engineering and commodity grade resins to custom injection molders and extruders. The company sells its products through direct sales personnel, distributors, and commissioned sales agents. The company was formerly known as PolyOne Corporation and changed its name to Avient Corporation in June 2020. Avient Corporation was founded in 1927 and is headquartered in Avon Lake, Ohio.
Latest AVNT News From Around the Web
Below are the latest news stories about AVIENT CORP that investors may wish to consider to help them evaluate AVNT as an investment opportunity.
Are Options Traders Betting on a Big Move in Avient (AVNT) Stock?Investors need to pay close attention to Avient (AVNT) stock based on the movements in the options market lately. |
Avient To Hold Fourth Quarter 2022 Conference CallAvient Corporation (NYSE: AVNT), a leading provider of specialized and sustainable material solutions, intends to release its fourth quarter 2022 earnings before the market opens on Wednesday, February 15, 2023. The company will then host a webcast with a slide presentation at 8:00 a.m. Eastern Time on Wednesday, February 15, 2023. |
An Intrinsic Calculation For Avient Corporation (NYSE:AVNT) Suggests It's 49% UndervaluedToday we will run through one way of estimating the intrinsic value of Avient Corporation ( NYSE:AVNT ) by taking the... |
Avient: A Transformed Business With High Resiliency (NYSE:AVNT)Avient is now a much more resilient company with 60% of EBITDA generated from less cyclical end markets. See why I''m bullish on AVNT stock. |
Avient (NYSE:AVNT) investors are sitting on a loss of 35% if they invested a year agoPassive investing in an index fund is a good way to ensure your own returns roughly match the overall market. When you... |
AVNT Price Returns
1-mo | 24.23% |
3-mo | 47.99% |
6-mo | -1.80% |
1-year | -14.69% |
3-year | 33.33% |
5-year | 10.49% |
YTD | 25.00% |
2022 | -38.23% |
2021 | 41.33% |
2020 | 12.94% |
2019 | 31.90% |
2018 | -33.01% |
AVNT Dividends
Ex-Dividend Date | Type | Payout Amount | Change | ||||||
---|---|---|---|---|---|---|---|---|---|
Loading, please wait... |
Loading social stream, please wait...