Avnet, Inc. (AVT): Price and Financial Metrics
GET POWR RATINGS... FREE!
AVT POWR Grades
- Momentum is the dimension where AVT ranks best; there it ranks ahead of 91.37% of US stocks.
- The strongest trend for AVT is in Quality, which has been heading down over the past 177 days.
- AVT ranks lowest in Sentiment; there it ranks in the 9th percentile.
AVT Stock Summary
- AVNET INC's stock had its IPO on January 1, 1986, making it an older stock than 93.5% of US equities in our set.
- Of note is the ratio of AVNET INC's sales and general administrative expense to its total operating expenses; 97.99% of US stocks have a lower such ratio.
- With a price/sales ratio of 0.15, AVNET INC has a higher such ratio than just 4.26% of stocks in our set.
- Stocks with similar financial metrics, market capitalization, and price volatility to AVNET INC are PDCO, ABG, M, RYI, and ARHS.
- Visit AVT's SEC page to see the company's official filings. To visit the company's web site, go to www.avnet.com.
AVT Valuation Summary
- AVT's price/sales ratio is 0.2; this is 91.67% lower than that of the median Technology stock.
- Over the past 243 months, AVT's EV/EBIT ratio has gone up 40.5.
Below are key valuation metrics over time for AVT.
Stock | Date | P/S | P/B | P/E | EV/EBIT |
---|---|---|---|---|---|
AVT | 2023-03-21 | 0.2 | 0.9 | 4.6 | 5.9 |
AVT | 2023-03-20 | 0.2 | 0.9 | 4.6 | 5.9 |
AVT | 2023-03-17 | 0.1 | 0.9 | 4.6 | 5.9 |
AVT | 2023-03-16 | 0.2 | 0.9 | 4.6 | 5.9 |
AVT | 2023-03-15 | 0.1 | 0.9 | 4.5 | 5.8 |
AVT | 2023-03-14 | 0.1 | 0.9 | 4.6 | 5.9 |
AVT Growth Metrics
- Its 2 year cash and equivalents growth rate is now at -50.46%.
- Its 5 year cash and equivalents growth rate is now at -64.34%.
- Its 4 year net cashflow from operations growth rate is now at 401.91%.

The table below shows AVT's growth in key financial areas (numbers in millions of US dollars).
Date | Revenue | Operating Cash Flow | Net Income to Common Stock |
---|---|---|---|
2022-12-31 | 26,328.45 | -922.602 | 858.387 |
2022-09-30 | 25,476.15 | -833.491 | 765.322 |
2022-06-30 | 24,310.71 | -219.31 | 692.379 |
2022-03-31 | 23,164.79 | -125.995 | 530.911 |
2021-12-31 | 21,593.36 | -379.654 | 454.978 |
2021-09-30 | 20,396.31 | -62.463 | 323.32 |
AVT's Quality Factors
The “Quality” component of the POWR Ratings focuses on 31 different factors of a companies fundamentals and operational strength. Here are some key insights as we drill into the specifics of these quality attributes.- AVT has a Quality Grade of C, ranking ahead of 60.32% of graded US stocks.
- AVT's asset turnover comes in at 2.347 -- ranking 28th of 105 Wholesale stocks.
- PDCO, PLUS, and HLF are the stocks whose asset turnover ratios are most correlated with AVT.
The table below shows AVT's key quality metrics over time.
Period | Asset Turnover | Gross Margin | ROIC |
---|---|---|---|
2021-10-02 | 2.347 | 0.117 | 0.071 |
2021-07-03 | 2.302 | 0.115 | 0.044 |
2021-04-03 | 2.231 | 0.112 | 0.026 |
2021-01-02 | 2.175 | 0.113 | -0.011 |
2020-10-03 | 2.142 | 0.115 | -0.012 |
2020-06-27 | 2.097 | 0.117 | -0.001 |
AVT Price Target
For more insight on analysts targets of AVT, see our AVT price target page. And for a list of of all stocks sorted by upside potential based on analyst target price, see our Top Price Target page.
Average Price Target | $46.13 | Average Broker Recommendation | 1.88 (Hold) |
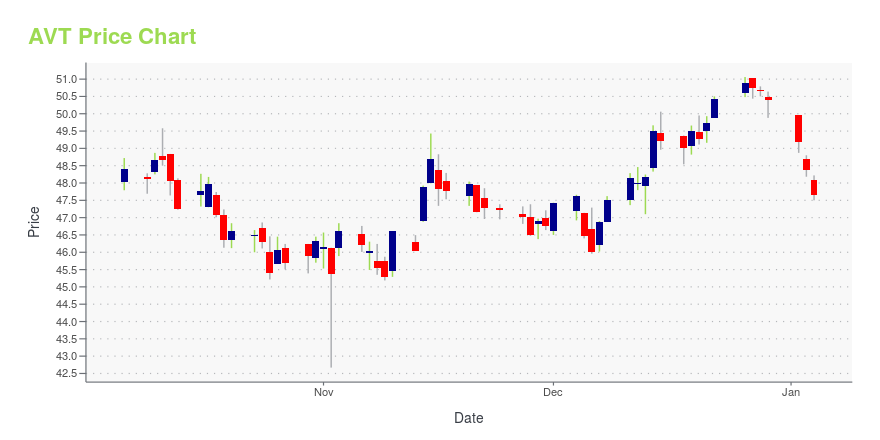
AVT Stock Price Chart Interactive Chart >
AVT Price/Volume Stats
Current price | $44.40 | 52-week high | $50.19 |
Prev. close | $44.10 | 52-week low | $35.45 |
Day low | $44.25 | Volume | 210,990 |
Day high | $44.79 | Avg. volume | 598,451 |
50-day MA | $44.85 | Dividend yield | 2.68% |
200-day MA | $43.02 | Market Cap | 4.06B |
Avnet, Inc. (AVT) Company Bio
Avnet Inc. distributes electronic components, enterprise computer and storage products, IT solutions and services, and embedded subsystems in the Americas, Europe, the Middle East, Africa, and the Asia/Pacific. The company was founded in 1955 and is based in Phoenix, Arizona.
Latest AVT News From Around the Web
Below are the latest news stories about AVNET INC that investors may wish to consider to help them evaluate AVT as an investment opportunity.
Top Tech Stocks for April 2023As inflation and interest rate concerns weigh on tech companies, these stocks lead the sector in value, growth, and momentum. |
The 7 Best Dividend-Paying Tech Stocks for Income InvestorsWhen you combine the growth potential of tech stocks with the wealth potential afforded by dividend stocks, the result is a winning combination. |
3 Tech Stocks Sitting in the Sweet SpotNow is the perfect time to buy tech stocks, as valuations remain battered due to macroeconomic headwinds that are cooling the markets. |
Is Weakness In Avnet, Inc. (NASDAQ:AVT) Stock A Sign That The Market Could be Wrong Given Its Strong Financial Prospects?It is hard to get excited after looking at Avnet's (NASDAQ:AVT) recent performance, when its stock has declined 8.0... |
Avnet (AVT) Down 3.2% Since Last Earnings Report: Can It Rebound?Avnet (AVT) reported earnings 30 days ago. What's next for the stock? We take a look at earnings estimates for some clues. |
AVT Price Returns
1-mo | -0.69% |
3-mo | 7.47% |
6-mo | 24.53% |
1-year | 9.13% |
3-year | 88.90% |
5-year | 19.42% |
YTD | 7.47% |
2022 | 3.39% |
2021 | 20.16% |
2020 | -14.86% |
2019 | 19.88% |
2018 | -7.24% |
AVT Dividends
Ex-Dividend Date | Type | Payout Amount | Change | ||||||
---|---|---|---|---|---|---|---|---|---|
Loading, please wait... |
Continue Researching AVT
Want to do more research on Avnet Inc's stock and its price? Try the links below:Avnet Inc (AVT) Stock Price | Nasdaq
Avnet Inc (AVT) Stock Quote, History and News - Yahoo Finance
Avnet Inc (AVT) Stock Price and Basic Information | MarketWatch
Loading social stream, please wait...