American Axle & Manufacturing Holdings, Inc. (AXL): Price and Financial Metrics
AXL Price/Volume Stats
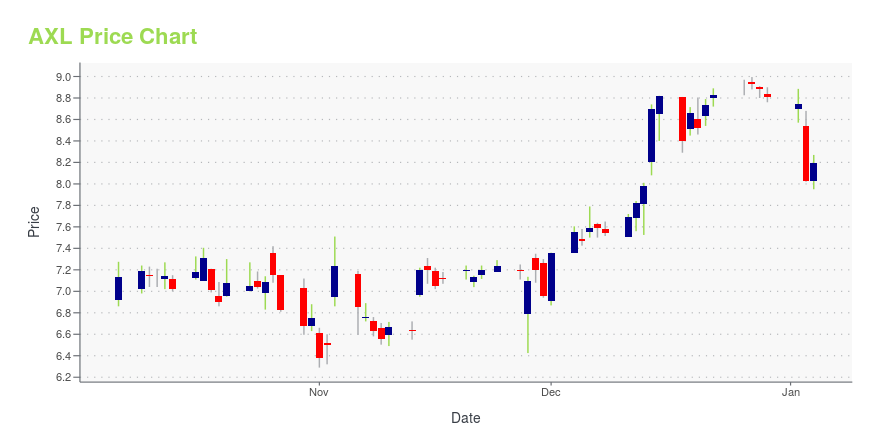
Current price | $7.04 | 52-week high | $11.96 |
Prev. close | $7.30 | 52-week low | $6.61 |
Day low | $6.98 | Volume | 599,091 |
Day high | $7.28 | Avg. volume | 994,699 |
50-day MA | $7.23 | Dividend yield | N/A |
200-day MA | $8.50 | Market Cap | 823.82M |
AXL Stock Price Chart Interactive Chart >
AXL POWR Grades
- AXL scores best on the Value dimension, with a Value rank ahead of 99.22% of US stocks.
- The strongest trend for AXL is in Momentum, which has been heading up over the past 179 days.
- AXL ranks lowest in Growth; there it ranks in the 28th percentile.
AXL Stock Summary
- AMERICAN AXLE & MANUFACTURING HOLDINGS INC's capital turnover -- a measure of revenue relative to shareholder's equity -- is better than 95.93% of US listed stocks.
- AXL's price/sales ratio is 0.14; that's higher than the P/S ratio of just 3.82% of US stocks.
- Shareholder yield, a measure of how much is returned to shareholders via dividends and share repurchases, for AXL comes in at 27.24% -- higher than that of 93.15% of stocks in our set.
- Stocks that are quantitatively similar to AXL, based on their financial statements, market capitalization, and price volatility, are PTVE, HRI, LDI, PLYA, and BERY.
- Visit AXL's SEC page to see the company's official filings. To visit the company's web site, go to www.aam.com.
AXL Valuation Summary
- AXL's EV/EBIT ratio is 14.1; this is 1.81% higher than that of the median Consumer Cyclical stock.
- Over the past 243 months, AXL's price/sales ratio has gone down 0.2.
Below are key valuation metrics over time for AXL.
Stock | Date | P/S | P/B | P/E | EV/EBIT |
---|---|---|---|---|---|
AXL | 2023-05-19 | 0.1 | 1.3 | 14.1 | 14.1 |
AXL | 2023-05-18 | 0.1 | 1.3 | 14.2 | 14.2 |
AXL | 2023-05-17 | 0.1 | 1.3 | 14.3 | 14.2 |
AXL | 2023-05-16 | 0.1 | 1.3 | 13.8 | 14.1 |
AXL | 2023-05-15 | 0.1 | 1.3 | 14.4 | 14.2 |
AXL | 2023-05-12 | 0.1 | 1.3 | 14.3 | 14.2 |
AXL Growth Metrics
- Its 4 year price growth rate is now at -66.08%.
- The 5 year price growth rate now stands at -66.08%.
- Its 2 year net cashflow from operations growth rate is now at -45.1%.

The table below shows AXL's growth in key financial areas (numbers in millions of US dollars).
Date | Revenue | Operating Cash Flow | Net Income to Common Stock |
---|---|---|---|
2022-12-31 | 5,802.4 | 448.9 | 64.3 |
2022-09-30 | 5,644.8 | 402.8 | 4.1 |
2022-06-30 | 5,322.7 | 407.4 | -24.8 |
2022-03-31 | 5,167.7 | 427.8 | -31.7 |
2021-12-31 | 5,156.6 | 538.4 | 5.9 |
2021-09-30 | 5,359.4 | 644.3 | 88.2 |
AXL's Quality Factors
The “Quality” component of the POWR Ratings focuses on 31 different factors of a companies fundamentals and operational strength. Here are some key insights as we drill into the specifics of these quality attributes.- AXL has a Quality Grade of B, ranking ahead of 85% of graded US stocks.
- AXL's asset turnover comes in at 0.941 -- ranking 34th of 68 Automobiles and Trucks stocks.
- STRT, MTOR, and UFAB are the stocks whose asset turnover ratios are most correlated with AXL.
The table below shows AXL's key quality metrics over time.
Period | Asset Turnover | Gross Margin | ROIC |
---|---|---|---|
2021-06-30 | 0.941 | 0.162 | 0.061 |
2021-03-31 | 0.804 | 0.128 | 0.021 |
2020-12-31 | 0.782 | 0.124 | -0.057 |
2020-09-30 | 0.758 | 0.113 | -0.130 |
2020-06-30 | 0.758 | 0.106 | -0.164 |
2020-03-31 | 0.889 | 0.142 | -0.118 |
AXL Price Target
For more insight on analysts targets of AXL, see our AXL price target page. And for a list of of all stocks sorted by upside potential based on analyst target price, see our Top Price Target page.
Average Price Target | $11.25 | Average Broker Recommendation | 1.83 (Hold) |
American Axle & Manufacturing Holdings, Inc. (AXL) Company Bio
American Axle & Manufacturing Holdings designs, engineers, validates, and manufactures driveline and drivetrain systems, and related components and chassis modules for the automotive industry. The company was founded in 1994 and is based in Detroit, Michigan.
Latest AXL News From Around the Web
Below are the latest news stories about AMERICAN AXLE & MANUFACTURING HOLDINGS INC that investors may wish to consider to help them evaluate AXL as an investment opportunity.
AAM Sponsors EcoCAR EV ChallengeAmerican Axle & Manufacturing Holdings, Inc. (AAM), (NYSE: AXL) is helping grow young engineering talent and improve electric vehicle efficiency through a Visionary Sponsorship of the EcoCAR EV Challenge. In the four-year student competition, university teams compete by engineering next generation battery electric vehicles (BEVs) and use automation and vehicle-to-everything (V2X) to create new vehicle features and technologies that decarbonize the automotive industry. |
5 Broker-Favored Stocks to Watch Amid the Debt-Ceiling StandoffWe believe that investors should keep a tab on broker-favorite stocks like American Airlines (AAL), Bread Financial (BFH), Avnet (AVT), Commercial Vehicle Group (CVGI) and American Axle (AXL). |
Here's Why You Should Retain American Axle (AXL) Stock NowAmerican Axle (AXL) rides high on the benefits of its latest innovative driveline solution and new collaborations. High costs of raw materials, labor and utilities might dim near-term prospects. |
American Axle (AXL) Incurs Narrower-Than-Anticipated Q1 LossAmerican Axle's (AXL) Q1 delivers lower than expected loss due to higher-than-anticipated sales from the Metal Foaming segment and higher-than-expected adjusted EBITDA in the Driveline segment. |
American Axle & Manufacturing Holdings, Inc. (NYSE:AXL) Q1 2023 Earnings Call TranscriptAmerican Axle & Manufacturing Holdings, Inc. (NYSE:AXL) Q1 2023 Earnings Call Transcript May 5, 2023 Operator: Good morning, everyone. My name is Jamie, and I will be your conference facilitator today. At this time, I would like to welcome everyone to the American Axle & Manufacturing First Quarter 2023 Earnings Conference Call. As a reminder, […] |
AXL Price Returns
1-mo | -4.99% |
3-mo | -22.38% |
6-mo | -24.06% |
1-year | -19.45% |
3-year | -19.54% |
5-year | -57.18% |
YTD | -9.97% |
2022 | -16.18% |
2021 | 11.87% |
2020 | -22.49% |
2019 | -3.06% |
2018 | -34.82% |
Continue Researching AXL
Want to do more research on American Axle & Manufacturing Holdings Inc's stock and its price? Try the links below:American Axle & Manufacturing Holdings Inc (AXL) Stock Price | Nasdaq
American Axle & Manufacturing Holdings Inc (AXL) Stock Quote, History and News - Yahoo Finance
American Axle & Manufacturing Holdings Inc (AXL) Stock Price and Basic Information | MarketWatch
Loading social stream, please wait...