AZZ Inc. (AZZ): Price and Financial Metrics
GET POWR RATINGS... FREE!
AZZ POWR Grades
- AZZ scores best on the Momentum dimension, with a Momentum rank ahead of 95.53% of US stocks.
- The strongest trend for AZZ is in Stability, which has been heading down over the past 179 days.
- AZZ ranks lowest in Value; there it ranks in the 25th percentile.
AZZ Stock Summary
- Azz Inc's stock had its IPO on January 1, 1986, making it an older stock than 92.84% of US equities in our set.
- Of note is the ratio of Azz Inc's sales and general administrative expense to its total operating expenses; 96.08% of US stocks have a lower such ratio.
- The volatility of Azz Inc's share price is greater than that of only 9.73% US stocks with at least 200 days of trading history.
- If you're looking for stocks that are quantitatively similar to Azz Inc, a group of peers worth examining would be UFI, ACA, LRN, ATRO, and NAII.
- AZZ's SEC filings can be seen here. And to visit Azz Inc's official web site, go to www.azz.com.
AZZ Valuation Summary
- AZZ's price/sales ratio is 1.5; this is 54.55% lower than that of the median Industrials stock.
- Over the past 243 months, AZZ's price/sales ratio has gone up 0.8.
- AZZ's price/sales ratio has moved up 0.8 over the prior 243 months.
Below are key valuation metrics over time for AZZ.
Stock | Date | P/S | P/B | P/E | EV/EBIT |
---|---|---|---|---|---|
AZZ | 2021-08-26 | 1.5 | 2.0 | 23.1 | 19.2 |
AZZ | 2021-08-25 | 1.5 | 2.1 | 23.3 | 19.3 |
AZZ | 2021-08-24 | 1.5 | 2.1 | 23.4 | 19.4 |
AZZ | 2021-08-23 | 1.5 | 2.1 | 23.2 | 19.3 |
AZZ | 2021-08-20 | 1.5 | 2.0 | 23.1 | 19.1 |
AZZ | 2021-08-19 | 1.5 | 2.0 | 22.6 | 18.8 |
AZZ Growth Metrics
- Its year over year revenue growth rate is now at -20.99%.
- Its 4 year revenue growth rate is now at 17.56%.
- The 4 year cash and equivalents growth rate now stands at -8.72%.

The table below shows AZZ's growth in key financial areas (numbers in millions of US dollars).
Date | Revenue | Operating Cash Flow | Net Income to Common Stock |
---|---|---|---|
2021-12-31 | 873.64 | 82.309 | 78.56 |
2021-09-30 | 868.526 | 97.627 | 77.178 |
2021-06-30 | 855.451 | 114.279 | 56.41 |
2021-03-31 | 838.917 | 92.035 | 39.614 |
2020-12-31 | 888.653 | 132.099 | 12.811 |
2020-09-30 | 953.169 | 138.69 | 15.143 |
AZZ's Quality Factors
The “Quality” component of the POWR Ratings focuses on 31 different factors of a companies fundamentals and operational strength. Here are some key insights as we drill into the specifics of these quality attributes.- AZZ has a Quality Grade of B, ranking ahead of 85.55% of graded US stocks.
- AZZ's asset turnover comes in at 0.854 -- ranking 16th of 53 Electrical Equipment stocks.
- POWL, OESX, and LYTS are the stocks whose asset turnover ratios are most correlated with AZZ.
The table below shows AZZ's key quality metrics over time.
Period | Asset Turnover | Gross Margin | ROIC |
---|---|---|---|
2021-08-31 | 0.854 | 0.246 | 0.159 |
2021-05-31 | 0.846 | 0.239 | 0.129 |
2021-02-28 | 0.827 | 0.225 | 0.102 |
2020-11-30 | 0.860 | 0.218 | 0.060 |
2020-08-31 | 0.887 | 0.217 | 0.066 |
2020-05-31 | 0.893 | 0.216 | 0.090 |
AZZ Price Target
For more insight on analysts targets of AZZ, see our AZZ price target page. And for a list of of all stocks sorted by upside potential based on analyst target price, see our Top Price Target page.
Average Price Target | $61.00 | Average Broker Recommendation | 1.67 (Moderate Buy) |
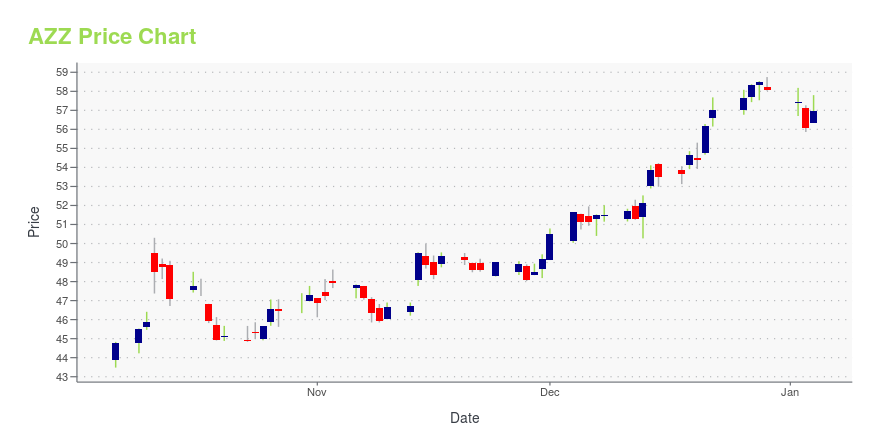
AZZ Stock Price Chart Interactive Chart >
AZZ Price/Volume Stats
Current price | $43.83 | 52-week high | $58.59 |
Prev. close | $43.55 | 52-week low | $42.28 |
Day low | $43.28 | Volume | 84,000 |
Day high | $44.12 | Avg. volume | 124,888 |
50-day MA | $46.67 | Dividend yield | 1.55% |
200-day MA | $50.89 | Market Cap | 1.08B |
AZZ Inc. (AZZ) Company Bio
AZZ Incorporated is a global provider of galvanizing services, welding solutions, specialty electrical equipment and highly engineered services to the markets of power generation, transmission, distribution and industrial in protecting metal and electrical systems used to build and enhance the world's infrastructure. The company was founded in 1956 and is based in Fort Worth, Texas.
Latest AZZ News From Around the Web
Below are the latest news stories about Azz Inc that investors may wish to consider to help them evaluate AZZ as an investment opportunity.
AZZ Inc. Consensus Indicates Potential 24.6% UpsideAZZ Inc. with ticker code (AZZ) have now 2 analysts covering the stock. The analyst consensus points to a rating of ''Buy''. The target price ranges between 62 and 62 calculating the average target price we see 62. Given that the stocks previous close was at 49.77 this would imply there is a potential upside of 24.6%. The 50 day MA is 51.19 and the 200 day moving average is 52.77. The company has a market capitalisation of $1,214m. Company Website: https://www.azz.com [stock_market_widget type="chart" template="basic" color="green" assets=AZZ" range="6mo" interval="1d" axes="true" cursor="true" api="yf"] The potential market cap would be $1,512m based on the market concensus. AZZ Inc. provides galvanizing and metal coating solutions, welding solutions, specialty electrical equipment, an... |
An Intrinsic Calculation For AZZ Inc. (NYSE:AZZ) Suggests It's 27% UndervaluedHow far off is AZZ Inc. ( NYSE:AZZ ) from its intrinsic value? Using the most recent financial data, we'll take a look... |
Crawford Investment Counsel Inc Buys Healthcare Services Group Inc, Wells Fargo, TE ...Atlanta, GA, based Investment company Crawford Investment Counsel Inc (Current Portfolio) buys Healthcare Services Group Inc, Wells Fargo, TE Connectivity, Hasbro Inc, AT&T Inc, sells Fidelity National Information Services Inc, , Compass Minerals International Inc, Kyndryl Holdings Inc, Moody's Corporation during the 3-months ended 2021Q4, according to the most recent filings of the investment company, Crawford Investment Counsel Inc. |
AZZ (AZZ) Loses 16.5% in 4 Weeks, Here's Why a Trend Reversal May be Around the CornerAZZ (AZZ) is technically in oversold territory now, so the heavy selling pressure might have exhausted. This along with strong agreement among Wall Street analysts in raising earnings estimates could lead to a trend reversal for the stock. |
Sidoti Winter Virtual Small Cap Investor Conference* Presentation Times and Weblinks Released for Over 70 Presenting Companies * Wednesday and Thursday, January 19th-20th, 2022NEW YORK, NY / ACCESSWIRE / January 18, 2022 / Sidoti & Company, LLC has released the presentation schedule and weblinks for its two-day January Small Cap Virtual Conference taking place Wednesday and Thursday, January 19th-20th, 2022. The links can also be found at www. |
AZZ Price Returns
1-mo | -6.63% |
3-mo | -8.15% |
6-mo | -16.79% |
1-year | -15.10% |
3-year | 6.53% |
5-year | -13.58% |
YTD | -20.16% |
2021 | 18.10% |
2020 | 5.34% |
2019 | 15.65% |
2018 | -19.88% |
2017 | -19.00% |
AZZ Dividends
Ex-Dividend Date | Type | Payout Amount | Change | ||||||
---|---|---|---|---|---|---|---|---|---|
Loading, please wait... |
Continue Researching AZZ
Want to see what other sources are saying about Azz Inc's financials and stock price? Try the links below:Azz Inc (AZZ) Stock Price | Nasdaq
Azz Inc (AZZ) Stock Quote, History and News - Yahoo Finance
Azz Inc (AZZ) Stock Price and Basic Information | MarketWatch
Loading social stream, please wait...