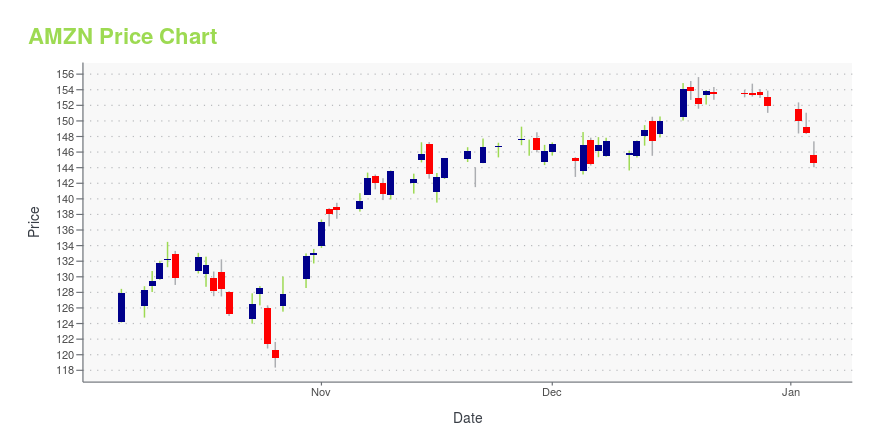
Amazon.com, Inc. (AMZN): Price and Financial Metrics
GET POWR RATINGS... FREE!
AMZN Price/Volume Stats
Current price | $120.11 | 52-week high | $146.57 |
Prev. close | $115.00 | 52-week low | $81.43 |
Day low | $116.02 | Volume | 96,779,800 |
Day high | $121.50 | Avg. volume | 66,905,039 |
50-day MA | $105.55 | Dividend yield | N/A |
200-day MA | $105.17 | Market Cap | 1.23T |
AMZN Stock Price Chart Interactive Chart >
AMZN POWR Grades
- Sentiment is the dimension where AMZN ranks best; there it ranks ahead of 98.83% of US stocks.
- The strongest trend for AMZN is in Growth, which has been heading up over the past 179 days.
- AMZN ranks lowest in Value; there it ranks in the 12th percentile.
AMZN Stock Summary
- With a market capitalization of $1,197,896,293,074, AMAZON COM INC has a greater market value than 99.94% of US stocks.
- With a price/earnings ratio of 278.97, AMAZON COM INC P/E ratio is greater than that of about 98.05% of stocks in our set with positive earnings.
- Of note is the ratio of AMAZON COM INC's sales and general administrative expense to its total operating expenses; just 11.37% of US stocks have a lower such ratio.
- Stocks that are quantitatively similar to AMZN, based on their financial statements, market capitalization, and price volatility, are GOOGL, NVDA, BRK.B, META, and TSLA.
- AMZN's SEC filings can be seen here. And to visit AMAZON COM INC's official web site, go to www.amazon.com.
AMZN Valuation Summary
- In comparison to the median Technology stock, AMZN's price/sales ratio is 15.38% lower, now standing at 2.2.
- Over the past 243 months, AMZN's EV/EBIT ratio has gone down 1705.8.
Below are key valuation metrics over time for AMZN.
Stock | Date | P/S | P/B | P/E | EV/EBIT |
---|---|---|---|---|---|
AMZN | 2023-05-22 | 2.2 | 7.6 | 274.8 | 206.3 |
AMZN | 2023-05-19 | 2.3 | 7.7 | 277.8 | 208.4 |
AMZN | 2023-05-18 | 2.3 | 7.8 | 282.3 | 211.6 |
AMZN | 2023-05-17 | 2.3 | 7.7 | 276.0 | 207.1 |
AMZN | 2023-05-16 | 2.2 | 7.5 | 271.0 | 203.7 |
AMZN | 2023-05-15 | 2.2 | 7.4 | 265.7 | 200.0 |
AMZN Growth Metrics
- The 2 year net income to common stockholders growth rate now stands at 102.74%.
- The year over year price growth rate now stands at -28.32%.
- The 4 year net cashflow from operations growth rate now stands at 133.54%.

The table below shows AMZN's growth in key financial areas (numbers in millions of US dollars).
Date | Revenue | Operating Cash Flow | Net Income to Common Stock |
---|---|---|---|
2022-12-31 | 513,983 | 46,752 | -2,722 |
2022-09-30 | 502,191 | 39,665 | 11,323 |
2022-06-30 | 485,902 | 35,574 | 11,607 |
2022-03-31 | 477,748 | 39,324 | 21,413 |
2021-12-31 | 469,822 | 46,327 | 33,364 |
2021-09-30 | 457,965 | 54,672 | 26,263 |
AMZN's Quality Factors
The “Quality” component of the POWR Ratings focuses on 31 different factors of a companies fundamentals and operational strength. Here are some key insights as we drill into the specifics of these quality attributes.- AMZN has a Quality Grade of B, ranking ahead of 82.65% of graded US stocks.
- AMZN's asset turnover comes in at 1.321 -- ranking 98th of 165 Retail stocks.
- ELA, BIG, and KR are the stocks whose asset turnover ratios are most correlated with AMZN.
The table below shows AMZN's key quality metrics over time.
Period | Asset Turnover | Gross Margin | ROIC |
---|---|---|---|
2021-09-30 | 1.321 | 0.413 | 0.121 |
2021-06-30 | 1.378 | 0.407 | 0.145 |
2021-03-31 | 1.415 | 0.400 | 0.151 |
2020-12-31 | 1.426 | 0.396 | 0.131 |
2020-09-30 | 1.410 | 0.402 | 0.123 |
2020-06-30 | 1.424 | 0.403 | 0.110 |
AMZN Price Target
For more insight on analysts targets of AMZN, see our AMZN price target page. And for a list of of all stocks sorted by upside potential based on analyst target price, see our Top Price Target page.
Average Price Target | $4,157.35 | Average Broker Recommendation | 1.34 (Strong Buy) |
Amazon.com, Inc. (AMZN) Company Bio
Originally called “Cadabra,” Amazon.com, Inc’s website was launched on July 16th, 1995 by CEO and founder Jeff Bezos, selling only books online. Amazon provides a full suite of online retail shopping services. Moreover, the company has expanded beyond retail e-commerce to focus on four discrete customer sets: consumers, sellers, enterprises, and content creators. The company also provides other marketing and promotional services, such as online advertising and co-branded credit card agreements. In addition, Amazon manufactures and sells products such as, Kindle E-reader, Fire tablets, Fire TV, Amazon Echo, and Alexa. The company operates through three segments: North America, International, and Amazon Web Services (AWS). The North America segment consists of retail sales of consumer products and subscriptions through North America-focused websites such as www.amazon.com and www.amazon.ca. The International segment consists of retail sales of consumer products and subscriptions through internationally focused locations. AWS is the largest cloud computing platform, and the primary profit driver for Amazon. In 2020, AWS broke the record of being a $10 billion business. Amazon controls more than a third of the cloud market, almost twice its next closest competitor.
Latest AMZN News From Around the Web
Below are the latest news stories about AMAZON COM INC that investors may wish to consider to help them evaluate AMZN as an investment opportunity.
Short-Term Pain Setting Up Long-Term Stock Market GainsLast year, energy stocks were the darlings while mega-cap tech companies were crushed. This year, energy and small-cap equities have been dead weight while mega-cap technology stocks have regained their leadership. |
Reflections On Investing: US Tech Stocks – The Big Get BiggerFive US tech companies account for 25% of the S&P 500 market cap. This video discusses the resurgence of big US tech and what it means for investors. |
Benefit From The Tech Rally And Get IncomeFor months, the share prices of most stocks have been in the doldrums or worse. Large-cap tech stocks have been the exception. Let’s check how a couple of covered call ETFs have performed compared to the most popular tech stock ETF. |
7 Stocks That Could Be the Next $2 Trillion-Dollar CompaniesAI, the cloud transition and success in the pharmaceutical sector will help these firms become $2 trillion companies. |
3 E-Commerce Stocks to Set to Surge on an Economic RecoveryThese e-commerce stocks to buy took a beating in the 2022 stock market rout last year, but are poised for incredible gains in the future. |
AMZN Price Returns
1-mo | 13.90% |
3-mo | 27.46% |
6-mo | 24.71% |
1-year | 4.56% |
3-year | -1.41% |
5-year | 48.19% |
YTD | 42.99% |
2022 | -49.50% |
2021 | 2.38% |
2020 | 76.26% |
2019 | 23.03% |
2018 | 28.43% |
Continue Researching AMZN
Want to do more research on Amazon Com Inc's stock and its price? Try the links below:Amazon Com Inc (AMZN) Stock Price | Nasdaq
Amazon Com Inc (AMZN) Stock Quote, History and News - Yahoo Finance
Amazon Com Inc (AMZN) Stock Price and Basic Information | MarketWatch
Loading social stream, please wait...