Banner Corporation (BANR): Price and Financial Metrics
BANR Price/Volume Stats
Current price | $45.77 | 52-week high | $75.72 |
Prev. close | $47.85 | 52-week low | $41.57 |
Day low | $45.27 | Volume | 195,800 |
Day high | $47.79 | Avg. volume | 194,737 |
50-day MA | $48.70 | Dividend yield | 4.29% |
200-day MA | $60.04 | Market Cap | 1.57B |
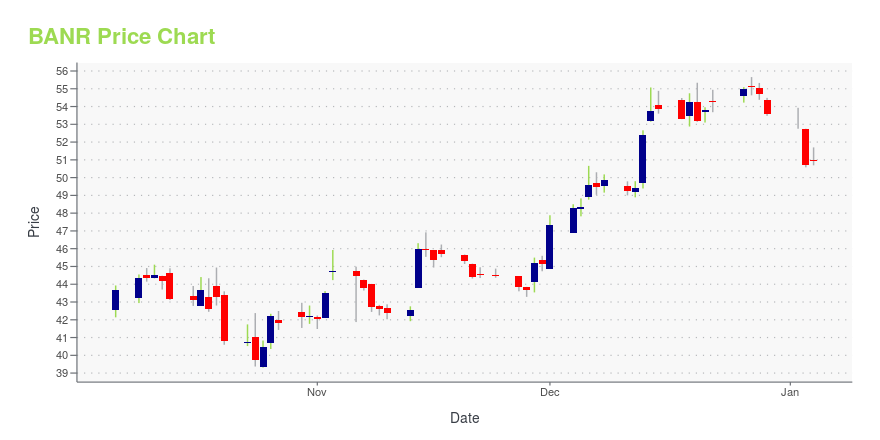
BANR Stock Price Chart Interactive Chart >
BANR POWR Grades
- Growth is the dimension where BANR ranks best; there it ranks ahead of 68.01% of US stocks.
- BANR's strongest trending metric is Stability; it's been moving down over the last 179 days.
- BANR's current lowest rank is in the Quality metric (where it is better than 28.69% of US stocks).
BANR Stock Summary
- BANR's one year PEG ratio, measuring expected growth in earnings next year relative to current common stock price is 147.67 -- higher than 84.32% of US-listed equities with positive expected earnings growth.
- With a price/earnings ratio of 7.69, BANNER CORP P/E ratio is greater than that of about just 24.04% of stocks in our set with positive earnings.
- BANR's equity multiplier -- a measure of assets relative to shareholders'equity -- is greater than that of 91.49% of US stocks.
- If you're looking for stocks that are quantitatively similar to BANNER CORP, a group of peers worth examining would be HTLF, SRCE, GABC, CVLY, and CCBG.
- Visit BANR's SEC page to see the company's official filings. To visit the company's web site, go to www.bannerbank.com.
BANR Valuation Summary
- BANR's price/earnings ratio is 7.6; this is 10.59% lower than that of the median Financial Services stock.
- Over the past 243 months, BANR's EV/EBIT ratio has gone down 50.8.
Below are key valuation metrics over time for BANR.
Stock | Date | P/S | P/B | P/E | EV/EBIT |
---|---|---|---|---|---|
BANR | 2023-05-19 | 2.5 | 1.0 | 7.6 | 7.6 |
BANR | 2023-05-18 | 2.5 | 1.0 | 7.7 | 7.7 |
BANR | 2023-05-17 | 2.5 | 1.1 | 7.8 | 7.8 |
BANR | 2023-05-16 | 2.4 | 1.0 | 7.3 | 7.3 |
BANR | 2023-05-15 | 2.4 | 1.0 | 7.3 | 7.4 |
BANR | 2023-05-12 | 2.3 | 0.9 | 7.0 | 7.1 |
BANR Growth Metrics
- Its 4 year cash and equivalents growth rate is now at -1.9%.
- Its 2 year cash and equivalents growth rate is now at 574.03%.
- Its 4 year price growth rate is now at -40.1%.

The table below shows BANR's growth in key financial areas (numbers in millions of US dollars).
Date | Revenue | Operating Cash Flow | Net Income to Common Stock |
---|---|---|---|
2022-12-31 | 618.07 | 238.051 | 195.378 |
2022-09-30 | 603.88 | 129.222 | 190.925 |
2022-06-30 | 612.057 | 97.231 | 191.739 |
2022-03-31 | 620.553 | 29.751 | 198.156 |
2021-12-31 | 626.695 | 301.578 | 201.048 |
2021-09-30 | 620.995 | 316.947 | 190.078 |
BANR's Quality Factors
The “Quality” component of the POWR Ratings focuses on 31 different factors of a companies fundamentals and operational strength. Here are some key insights as we drill into the specifics of these quality attributes.- BANR has a Quality Grade of C, ranking ahead of 36.33% of graded US stocks.
- BANR's asset turnover comes in at 0.038 -- ranking 212th of 428 Banking stocks.
- HTLF, FBNC, and BUSE are the stocks whose asset turnover ratios are most correlated with BANR.
The table below shows BANR's key quality metrics over time.
Period | Asset Turnover | Gross Margin | ROIC |
---|---|---|---|
2021-06-30 | 0.038 | 1 | 0.015 |
2021-03-31 | 0.037 | 1 | 0.013 |
2020-12-31 | 0.036 | 1 | 0.010 |
2020-09-30 | 0.037 | 1 | 0.010 |
2020-06-30 | 0.039 | 1 | 0.011 |
2020-03-31 | 0.043 | 1 | 0.013 |
BANR Price Target
For more insight on analysts targets of BANR, see our BANR price target page. And for a list of of all stocks sorted by upside potential based on analyst target price, see our Top Price Target page.
Average Price Target | $60.00 | Average Broker Recommendation | 1.7 (Moderate Buy) |
Banner Corporation (BANR) Company Bio
Banner Corporation provides commercial banking and financial products and services to individuals, businesses, and public sector entities primarily in Washington, Oregon, and Idaho. The company was founded in 1890 and is based in Walla Walla, Washington.
Latest BANR News From Around the Web
Below are the latest news stories about BANNER CORP that investors may wish to consider to help them evaluate BANR as an investment opportunity.
Banner Corporation Announces Results of Annual Meeting, Shareholders Approve All Proposals and Confirm All Nominated Directors to BoardWALLA WALLA, Wash., May 26, 2023 (GLOBE NEWSWIRE) -- Banner Corporation (NASDAQ GSM: BANR), (“Banner” or the “Company”), the parent company of Banner Bank, today announced that shareholders approved all proposals and re-elected all director nominees at its 2023 Annual Meeting of Shareholders held virtually on May 24, 2023. About the Company Banner Corporation is a $15.53 billion bank holding company operating one commercial bank in four Western states through a network of branches offering a ful |
Zacks Industry Outlook Highlights Citizens Financial, New York Community Bancorp and BannerCitizens Financial, New York Community Bancorp and Banner have been highlighted in this Industry Outlook article. |
Banner (NASDAQ:BANR) Ticks All The Boxes When It Comes To Earnings GrowthThe excitement of investing in a company that can reverse its fortunes is a big draw for some speculators, so even... |
Banner Named One of the Most Trustworthy Companies in AmericaWALLA WALLA, Wash., May 05, 2023--Newsweek has named Banner Bank one of the 2023 Most Trustworthy Companies in America |
Banner Corporation (NASDAQ:BANR) Q1 2023 Earnings Call TranscriptBanner Corporation (NASDAQ:BANR) Q1 2023 Earnings Call Transcript April 20, 2023 Banner Corporation beats earnings expectations. Reported EPS is $1.61, expectations were $1.58. Operator Good morning and thank you for attending today’s First Quarter 2023 Earnings Call for Banner Corporation. My name is Jason and I’ll be the moderator for today’s call. [Operator Instructions]I would […] |
BANR Price Returns
1-mo | 1.35% |
3-mo | -24.46% |
6-mo | -29.35% |
1-year | -18.65% |
3-year | 16.80% |
5-year | -11.57% |
YTD | -26.33% |
2022 | 7.20% |
2021 | 34.29% |
2020 | -12.53% |
2019 | 8.98% |
2018 | 0.06% |
BANR Dividends
Ex-Dividend Date | Type | Payout Amount | Change | ||||||
---|---|---|---|---|---|---|---|---|---|
Loading, please wait... |
Continue Researching BANR
Here are a few links from around the web to help you further your research on Banner Corp's stock as an investment opportunity:Banner Corp (BANR) Stock Price | Nasdaq
Banner Corp (BANR) Stock Quote, History and News - Yahoo Finance
Banner Corp (BANR) Stock Price and Basic Information | MarketWatch
Loading social stream, please wait...