Bed Bath & Beyond Inc. (BBBY): Price and Financial Metrics


Bed Bath & Beyond Inc. (BBBY): $0.43

-0.17 (-28.00%)

POWR Rating

Component Grades

Growth

S

Value

I

Momentum

G

Stability

N

Sentiment

U

Quality

P

BBBY POWR Grades

  • Growth is the dimension where BBBY ranks best; there it ranks ahead of 35.31% of US stocks.
  • The strongest trend for BBBY is in Quality, which has been heading down over the past 177 days.
  • BBBY's current lowest rank is in the Stability metric (where it is better than 0.54% of US stocks).

BBBY Stock Summary

  • BBBY's price/sales ratio is 0.02; that's higher than the P/S ratio of just 0.16% of US stocks.
  • BBBY's equity multiplier -- a measure of assets relative to shareholders'equity -- is greater than that of just 1.61% of US stocks.
  • BED BATH & BEYOND INC's shareholder yield -- a measure of how much capital is returned to stockholders via dividends and buybacks -- is -798.39%, greater than the shareholder yield of only 0.88% of stocks in our set.
  • Stocks that are quantitatively similar to BBBY, based on their financial statements, market capitalization, and price volatility, are CYH, TUP, CURV, RMNI, and HRB.
  • BBBY's SEC filings can be seen here. And to visit BED BATH & BEYOND INC's official web site, go to www.bedbathandbeyond.com.

BBBY Valuation Summary

  • In comparison to the median Consumer Cyclical stock, BBBY's price/sales ratio is 100% lower, now standing at 0.
  • BBBY's EV/EBIT ratio has moved down 24.9 over the prior 243 months.

Below are key valuation metrics over time for BBBY.

Stock Date P/S P/B P/E EV/EBIT
BBBY 2023-03-22 0 -0.1 -0.1 -3
BBBY 2023-03-21 0 -0.1 -0.1 -3
BBBY 2023-03-20 0 -0.1 -0.1 -3
BBBY 2023-03-17 0 -0.2 -0.1 -3
BBBY 2023-03-16 0 -0.2 -0.1 -3
BBBY 2023-03-15 0 -0.2 -0.1 -3

BBBY Growth Metrics

    The 5 year net cashflow from operations growth rate now stands at -43.28%.
  • Its 5 year revenue growth rate is now at -8.65%.
  • Its 5 year net income to common stockholders growth rate is now at -189.59%.
Over the past 52 months, BBBY's revenue has gone down $6,148,544,000.

The table below shows BBBY's growth in key financial areas (numbers in millions of US dollars).

Date Revenue Operating Cash Flow Net Income to Common Stock
2022-12-31 6,210.944 -607.419 -1,275.896
2022-09-30 6,829.706 -610.609 -1,159.359
2022-06-30 7,377.384 -336.956 -866.415
2022-03-31 7,867.778 17.854 -559.623
2021-12-31 8,435.523 -189.034 -391.459
2021-09-30 9,176.121 165.288 -190.471

BBBY's Quality Factors

The “Quality” component of the POWR Ratings focuses on 31 different factors of a companies fundamentals and operational strength. Here are some key insights as we drill into the specifics of these quality attributes.
  • BBBY has a Quality Grade of C, ranking ahead of 62.87% of graded US stocks.
  • BBBY's asset turnover comes in at 1.435 -- ranking 84th of 165 Retail stocks.
  • HVT, AAP, and CTRN are the stocks whose asset turnover ratios are most correlated with BBBY.

The table below shows BBBY's key quality metrics over time.

Period Asset Turnover Gross Margin ROIC
2021-08-28 1.435 0.329 -0.051
2021-05-29 1.467 0.344 0.021
2021-02-27 1.292 0.338 -0.039
2020-11-28 1.300 0.340 -0.044
2020-08-29 1.275 0.331 -0.029
2020-05-30 1.260 0.304 -0.093

BBBY Price Target

For more insight on analysts targets of BBBY, see our BBBY price target page. And for a list of of all stocks sorted by upside potential based on analyst target price, see our Top Price Target page.

Average Price Target $30.93 Average Broker Recommendation 2.12 (Hold)

BBBY Stock Price Chart Interactive Chart >

Price chart for BBBY

BBBY Price/Volume Stats
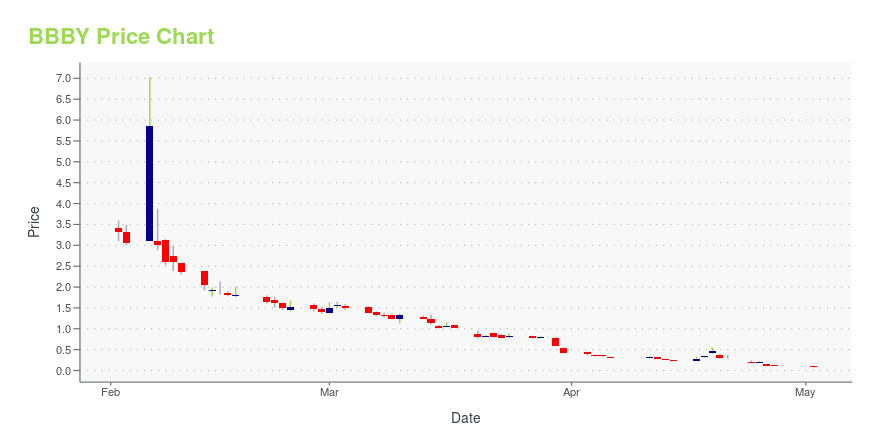
Current price $0.43 52-week high $30.00
Prev. close $0.59 52-week low $0.42
Day low $0.42 Volume 169,805,000
Day high $0.55 Avg. volume 77,880,828
50-day MA $1.84 Dividend yield N/A
200-day MA $4.83 Market Cap 50.14M

Bed Bath & Beyond Inc. (BBBY) Company Bio


Bed Bath & Beyond operates a chain of retail stores, offering a range of domestics merchandise, including bed linens and related items, bath items, kitchen textiles, home furnishings, fine tabletops, basic housewares, general home furnishings, and other merchandise. The company was founded in 1971 and is based in Union, New Jersey.


BBBY Latest News Stream


Event/Time News Detail
Loading, please wait...

BBBY Latest Social Stream


Loading social stream, please wait...

View Full BBBY Social Stream

Latest BBBY News From Around the Web

Below are the latest news stories about BED BATH & BEYOND INC that investors may wish to consider to help them evaluate BBBY as an investment opportunity.

Disney, First Citizens, Alibaba: Stocks That Defined the Week

Layoffs are still sweeping Corporate America. Disney started its first wave of layoffs in its plan to cut 7,000 jobs, including the elimination of its metaverse division and more than 300 streaming employees in Beijing. Electronic Arts and Roku also reported job cuts, while Meta Platforms Inc. plans lower bonus payouts and more frequent employee performance assessments amid its own revamp.

Yahoo | March 31, 2023

Bed Bath & Beyond stock closes at all-time low of 43 cents

Bed Bath & Beyond’s (BBBY) stock ended the quarter at an all time low, as the retailer taps the the public markets one more time in its latest effort to turn itself around.

Yahoo | March 31, 2023

Bed Bath & Beyond Stock Hit a New Low. Bankruptcy Could Still Happen.

The embattled retailer terminated a deal that gave it a billion-dollar lifeline, surprising investors who may have felt the company had just gained some stability.

Yahoo | March 31, 2023

Midday movers: Virgin Orbit, Bed Bath & Beyond, Tesla and more

By Liz Moyer

Yahoo | March 31, 2023

Find Everything You Need for Spring Gatherings and Celebrations at Bed Bath & Beyond® and buybuy BABY®

(Nasdaq: BBBY) Spring is officially here and with the warming weather and blooming flowers comes countless opportunities to entertain and create memorable moments with friends and loved ones. Shop Bed Bath & Beyond for everything needed to host a brunch, Easter luncheon or Passover Seder and buybuy BABY for special outfits, toys and more, to make magical memories.

Yahoo | March 31, 2023

Read More 'BBBY' Stories Here

BBBY Price Returns

1-mo -72.44%
3-mo -82.87%
6-mo -92.82%
1-year -98.12%
3-year -88.65%
5-year -97.64%
YTD -82.87%
2022 -82.78%
2021 -17.91%
2020 4.99%
2019 60.83%
2018 -46.62%

Continue Researching BBBY

Want to see what other sources are saying about Bed Bath & Beyond Inc's financials and stock price? Try the links below:

Bed Bath & Beyond Inc (BBBY) Stock Price | Nasdaq
Bed Bath & Beyond Inc (BBBY) Stock Quote, History and News - Yahoo Finance
Bed Bath & Beyond Inc (BBBY) Stock Price and Basic Information | MarketWatch

Get Free Updates

Join thousands of investors who get the latest news, insights and top rated picks from StockNews.com!


Page generated in 0.9031 seconds.