Flanigan's Enterprises, Inc. (BDL): Price and Financial Metrics
GET POWR RATINGS... FREE!
BDL Stock Summary
- Price to trailing twelve month operating cash flow for BDL is currently 0, higher than only 0.36% of US stocks with positive operating cash flow.
- Over the past twelve months, BDL has reported earnings growth of 594.4%, putting it ahead of 96.53% of US stocks in our set.
- Shareholder yield, a measure of how much is returned to shareholders via dividends and share repurchases, for BDL comes in at -3,164.56% -- higher than that of only 0.19% of stocks in our set.
- Stocks with similar financial metrics, market capitalization, and price volatility to Flanigans Enterprises Inc are AEI, TIRX, DSS, SIFY, and ITP.
- BDL's SEC filings can be seen here. And to visit Flanigans Enterprises Inc's official web site, go to www.flanigans.net.
BDL Valuation Summary
- In comparison to the median Consumer Cyclical stock, BDL's price/sales ratio is 78.57% lower, now standing at 0.3.
- BDL's EV/EBIT ratio has moved down 3.4 over the prior 243 months.
- BDL's price/earnings ratio has moved up 1.3 over the prior 243 months.
Below are key valuation metrics over time for BDL.
Stock | Date | P/S | P/B | P/E | EV/EBIT |
---|---|---|---|---|---|
BDL | 2021-08-27 | 0.3 | 0.9 | 4.2 | 4.7 |
BDL | 2021-08-26 | 0.3 | 0.9 | 4.1 | 4.7 |
BDL | 2021-08-25 | 0.3 | 0.9 | 4.1 | 4.7 |
BDL | 2021-08-24 | 0.3 | 0.9 | 4.1 | 4.7 |
BDL | 2021-08-23 | 0.3 | 0.9 | 4.2 | 4.7 |
BDL | 2021-08-20 | 0.4 | 0.9 | 4.3 | 4.8 |
BDL Growth Metrics
- Its year over year net cashflow from operations growth rate is now at 32.98%.
- Its 4 year net income to common stockholders growth rate is now at -3.26%.
- Its 2 year cash and equivalents growth rate is now at 16.55%.

The table below shows BDL's growth in key financial areas (numbers in millions of US dollars).
Date | Revenue | Operating Cash Flow | Net Income to Common Stock |
---|---|---|---|
2021-12-31 | 143.33 | 14,049.76 | 12.568 |
2021-09-30 | 137.307 | 14,049 | 11.784 |
2021-06-30 | 131.917 | 12.87 | 10.853 |
2021-03-31 | 117.645 | 11.664 | 3.199 |
2020-12-31 | 113.416 | 9.127 | 1.396 |
2020-09-30 | 112.977 | 8.785 | 1.11 |
BDL Stock Price Chart Interactive Chart >
BDL Price/Volume Stats
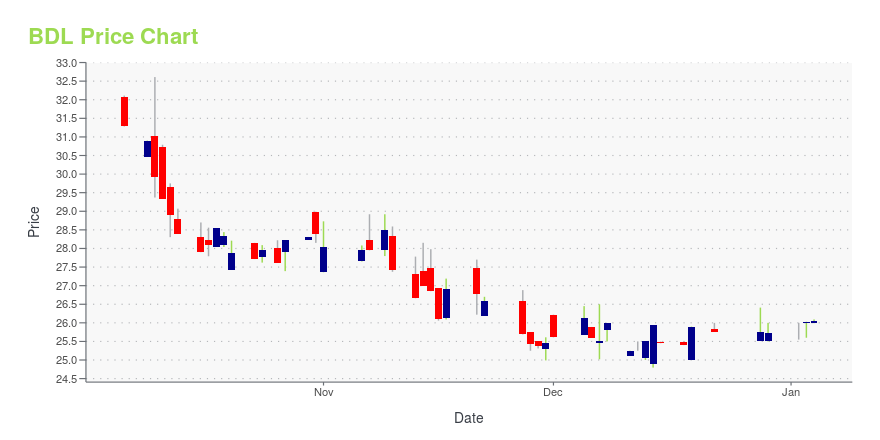
Current price | $34.71 | 52-week high | $41.90 |
Prev. close | $35.83 | 52-week low | $22.28 |
Day low | $34.71 | Volume | 700 |
Day high | $36.19 | Avg. volume | 6,540 |
50-day MA | $35.46 | Dividend yield | 2.88% |
200-day MA | $30.65 | Market Cap | 64.56M |
Latest BDL News From Around the Web
Below are the latest news stories about Flanigans Enterprises Inc that investors may wish to consider to help them evaluate BDL as an investment opportunity.
FLANIGAN'S REPORTS EARNINGS; DECLARES DIVIDENDFLANIGAN'S ENTERPRISES, INC., (NYSE AMERICAN: BDL) owners and operators of the "Flanigan's Seafood Bar and Grill" restaurants and "Big Daddy's" retail liquor storey today announced results for the 13 weeks ended January 1, 2022. The table below sets forth the results on a comparative basis with the 13 weeks ended January 2, 2021. On February 25, 2022, the Board of Directors declared a cash dividend of One Dollar ($1.00) per share to shareholders of record on March 31, 2022, payable on April 19, |
FLANIGAN'S REPORTS EARNINGSFLANIGAN'S ENTERPRISES, INC., (NYSE AMERICAN: BDL) owners and operators of the "Flanigan's Seafood Bar and Grill" restaurants and "Big Daddy's" retail liquor stores, today announced results for the 13 weeks and the 52 weeks ended October 2, 2021. The table below sets forth the results on a comparative basis with the 14 weeks and 53 weeks ended October 3, 2020. |
Flanigan''s Reports EarningsFORT LAUDERDALE, Fla., Aug. 18, 2021 /PRNewswire/ -- FLANIGAN''S ENTERPRISES, INC., (NYSE AMERICAN: BDL) owners and operators of the "Flanigan''s Seafood Bar and Grill" restaurants and "Big Daddy''s" retail liquor stores, today announced results for the 13 |
Flanigan''s Announces EarningsFORT LAUDERDALE, Fla., May 24, 2021 /PRNewswire/ -- FLANIGAN''S ENTERPRISES, INC., (NYSE AMERICAN: BDL) owners and operators of the "Flanigan''s Seafood Bar and Grill" restaurants and "Big Daddy''s" retail liquor stores, today announced results for the 13 weeks and the 26 weeks ended April |
Flanigan's Announces EarningsFLANIGAN'S ENTERPRISES, INC., (NYSE AMERICAN: BDL) owners and operators of the "Flanigan's Seafood Bar and Grill" restaurants and "Big Daddy's" retail liquor stores, today announced results for the 13 weeks and the 26 weeks ended April 3, 2021. The table below sets forth the results on a comparative basis with the 13 weeks and the 26 weeks ended March 28, 2020. |
BDL Price Returns
1-mo | -8.08% |
3-mo | 22.40% |
6-mo | 7.98% |
1-year | 25.58% |
3-year | 53.05% |
5-year | 45.56% |
YTD | 15.77% |
2021 | 56.23% |
2020 | -8.28% |
2019 | -13.44% |
2018 | 10.86% |
2017 | N/A |
BDL Dividends
Ex-Dividend Date | Type | Payout Amount | Change | ||||||
---|---|---|---|---|---|---|---|---|---|
Loading, please wait... |
Continue Researching BDL
Here are a few links from around the web to help you further your research on Flanigans Enterprises Inc's stock as an investment opportunity:Flanigans Enterprises Inc (BDL) Stock Price | Nasdaq
Flanigans Enterprises Inc (BDL) Stock Quote, History and News - Yahoo Finance
Flanigans Enterprises Inc (BDL) Stock Price and Basic Information | MarketWatch
Loading social stream, please wait...