
Franklin Resources Inc. (BEN): Price and Financial Metrics
BEN Price/Volume Stats
| Current price | $23.08 | 52-week high | $30.32 |
| Prev. close | $23.64 | 52-week low | $21.57 |
| Day low | $22.97 | Volume | 6,473,094 |
| Day high | $24.10 | Avg. volume | 3,674,715 |
| 50-day MA | $23.03 | Dividend yield | 5.34% |
| 200-day MA | $25.29 | Market Cap | 12.14B |
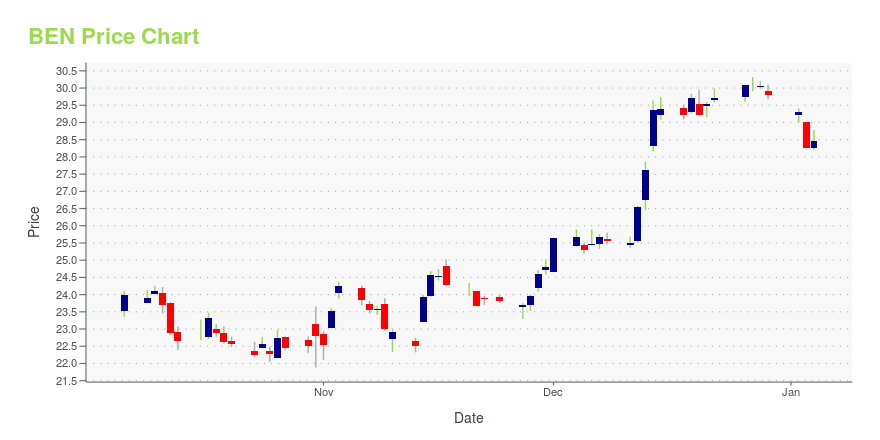
BEN Stock Price Chart Interactive Chart >
Franklin Resources Inc. (BEN) Company Bio
Franklin Resources, Inc. is an American multinational holding company that, together with its subsidiaries, is referred to as Franklin Templeton; it is a global investment firm founded in New York City in 1947 as Franklin Distributors, Inc. It is listed on the New York Stock Exchange under the ticker symbol BEN, in honor of Benjamin Franklin, for whom the company is named, and who was admired by founder Rupert Johnson Sr. In 1973, the company's headquarters moved from New York to San Mateo, California. As of October 12, 2020, Franklin Templeton held US$1.4 trillion in assets under management (AUM) on behalf of private, professional and institutional investors. (Source:Wikipedia)
Latest BEN News From Around the Web
Below are the latest news stories about FRANKLIN RESOURCES INC that investors may wish to consider to help them evaluate BEN as an investment opportunity.
Franklin Templeton Canada Announces Final December ETF Cash Distributions and Annual Reinvested DistributionsFranklin Templeton Canada today announced the final December 2023 cash distributions and the annual reinvested distributions for its ETFs and ETF series of mutual funds available to Canadian investors. This is an update to the estimated December 2023 cash distributions and annual reinvested distributions previously announced on December 19, 2023. |
Should Income Investors Look At Franklin Resources, Inc. (NYSE:BEN) Before Its Ex-Dividend?It looks like Franklin Resources, Inc. ( NYSE:BEN ) is about to go ex-dividend in the next four days. The ex-dividend... |
3 Franklin Templeton Mutual Funds to Bet on in the Current BackdropInvest in Franklin Templeton mutual funds like FRVFX, FCISX and FRUAX for steady returns alongside risk reduction in a volatile market. |
14 Cheap DRIP Stocks To Buy NowIn this article, we discuss 14 cheap DRIP stocks to buy now. You can skip our detailed analysis of dividend reinvestment plans and performance of dividend stocks in the past, and go directly to read 5 Cheap DRIP Stocks To Buy Now. Investing in dividend stocks is often seen as a game for patient investors […] |
10 Quality Retirement Stocks NowRetirees have had a challenge producing satisfactory income over the past decade, due to historically low interest rates which have brought down yields across fixed income and the stock market. |
BEN Price Returns
| 1-mo | 3.09% |
| 3-mo | -6.35% |
| 6-mo | -14.20% |
| 1-year | -14.74% |
| 3-year | -10.30% |
| 5-year | -17.28% |
| YTD | -19.70% |
| 2023 | 16.96% |
| 2022 | -17.52% |
| 2021 | 38.88% |
| 2020 | 1.46% |
| 2019 | -9.29% |
BEN Dividends
| Ex-Dividend Date | Type | Payout Amount | Change | ||||||
|---|---|---|---|---|---|---|---|---|---|
| Loading, please wait... | |||||||||
Continue Researching BEN
Want to do more research on Franklin Resources Inc's stock and its price? Try the links below:Franklin Resources Inc (BEN) Stock Price | Nasdaq
Franklin Resources Inc (BEN) Stock Quote, History and News - Yahoo Finance
Franklin Resources Inc (BEN) Stock Price and Basic Information | MarketWatch
Loading social stream, please wait...