Brown-Forman Corp. CI B (BF.B): Price and Financial Metrics
GET POWR RATINGS... FREE!
BF.B Price/Volume Stats
Current price | $61.58 | 52-week high | $78.15 |
Prev. close | $61.20 | 52-week low | $60.92 |
Day low | $61.08 | Volume | 1,028,900 |
Day high | $61.84 | Avg. volume | 1,290,270 |
50-day MA | $63.46 | Dividend yield | 1.34% |
200-day MA | $67.05 | Market Cap | 29.51B |
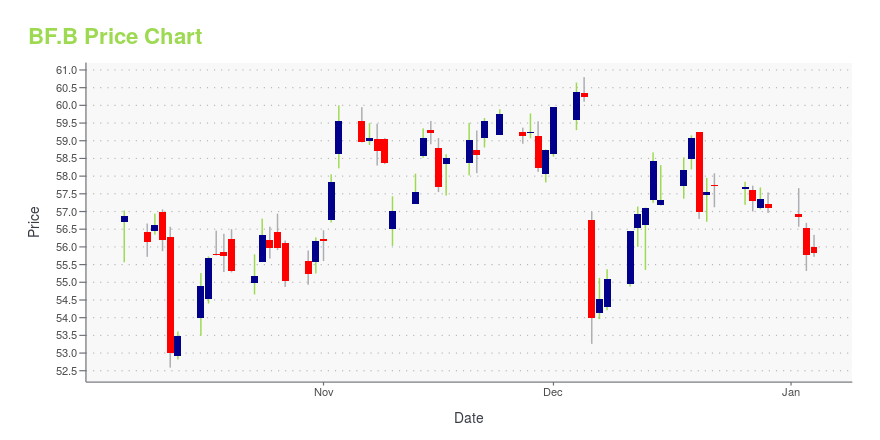
BF.B Stock Price Chart Interactive Chart >
BF.B POWR Grades
- BF.B scores best on the Stability dimension, with a Stability rank ahead of 88.74% of US stocks.
- The strongest trend for BF.B is in Quality, which has been heading down over the past 179 days.
- BF.B ranks lowest in Value; there it ranks in the 2nd percentile.
BF.B Stock Summary
- BF.B has a market capitalization of $29,621,867,173 -- more than approximately 92.53% of US stocks.
- BROWN FORMAN CORP's stock had its IPO on January 1, 1986, making it an older stock than 93.61% of US equities in our set.
- In terms of volatility of its share price, BF.B is more volatile than merely 4.16% of stocks we're observing.
- Stocks that are quantitatively similar to BF.B, based on their financial statements, market capitalization, and price volatility, are DOV, MKC, CHD, WIT, and CCEP.
- BF.B's SEC filings can be seen here. And to visit BROWN FORMAN CORP's official web site, go to www.brown-forman.com.
BF.B Valuation Summary
- In comparison to the median Consumer Defensive stock, BF.B's price/sales ratio is 554.55% higher, now standing at 7.2.
- Over the past 243 months, BF.B's price/sales ratio has gone up 4.9.
Below are key valuation metrics over time for BF.B.
Stock | Date | P/S | P/B | P/E | EV/EBIT |
---|---|---|---|---|---|
BF.B | 2023-05-23 | 7.2 | 9.9 | 41.5 | 31.3 |
BF.B | 2023-05-22 | 7.4 | 10.1 | 42.4 | 32.0 |
BF.B | 2023-05-19 | 7.3 | 10.0 | 42.0 | 31.7 |
BF.B | 2023-05-18 | 7.2 | 10.0 | 41.6 | 31.4 |
BF.B | 2023-05-17 | 7.3 | 10.0 | 41.7 | 31.5 |
BF.B | 2023-05-16 | 7.2 | 9.9 | 41.5 | 31.4 |
BF.B Growth Metrics
- Its 5 year net income to common stockholders growth rate is now at 23.62%.
- The year over year net cashflow from operations growth rate now stands at 14.57%.
- Its 5 year cash and equivalents growth rate is now at 270.88%.

The table below shows BF.B's growth in key financial areas (numbers in millions of US dollars).
Date | Revenue | Operating Cash Flow | Net Income to Common Stock |
---|---|---|---|
2022-09-30 | 4,134 | 917 | 886 |
2022-06-30 | 4,034 | 924 | 895 |
2022-03-31 | 3,933 | 936 | 838 |
2021-12-31 | 3,749 | 928 | 807 |
2021-09-30 | 3,623 | 869 | 767 |
2021-06-30 | 3,614 | 911 | 771 |
BF.B's Quality Factors
The “Quality” component of the POWR Ratings focuses on 31 different factors of a companies fundamentals and operational strength. Here are some key insights as we drill into the specifics of these quality attributes.- BF.B has a Quality Grade of A, ranking ahead of 97.3% of graded US stocks.
- BF.B's asset turnover comes in at 0.557 -- ranking 7th of 16 Beer & Liquor stocks.
- BTTR, JSDA, and BUD are the stocks whose asset turnover ratios are most correlated with BF.B.
The table below shows BF.B's key quality metrics over time.
Period | Asset Turnover | Gross Margin | ROIC |
---|---|---|---|
2021-07-31 | 0.557 | 0.604 | 0.192 |
2021-04-30 | 0.542 | 0.605 | 0.209 |
2021-01-31 | 0.542 | 0.610 | 0.214 |
2020-10-31 | 0.562 | 0.614 | 0.219 |
2020-07-31 | 0.582 | 0.625 | 0.224 |
2020-04-30 | 0.607 | 0.632 | 0.201 |
BF.B Price Target
For more insight on analysts targets of BF.B, see our BF.B price target page. And for a list of of all stocks sorted by upside potential based on analyst target price, see our Top Price Target page.
Average Price Target | $72.19 | Average Broker Recommendation | 2.12 (Hold) |
Brown-Forman Corp. CI B (BF.B) Company Bio
The Brown–Forman Corporation is an American company, one of the largest in the spirits and wine business. Based in Louisville, Kentucky, it manufactures several well known brands throughout the world, including Jack Daniel's, Old Forester, Woodford Reserve, GlenDronach, BenRiach, Glenglassaugh, Finlandia, Herradura, Korbel, and Chambord. Brown–Forman formerly owned Southern Comfort and Tuaca before selling them off in 2016. (Source:Wikipedia)
Latest BF.B News From Around the Web
Below are the latest news stories about BROWN FORMAN CORP that investors may wish to consider to help them evaluate BF.B as an investment opportunity.
7 Dividend Stocks for Risk-Averse InvestorsInvestors receive steady returns from these dividend stocks to buy while avoiding stress and losses. |
Quant Ratings Updated on 59 Stocksdecided to revise my Portfolio Grader recommendations for 59 blue chip stocks. |
BF.B Price Returns
1-mo | -5.39% |
3-mo | -4.78% |
6-mo | -15.17% |
1-year | -6.43% |
3-year | -2.31% |
5-year | 14.23% |
YTD | -5.95% |
2022 | -8.86% |
2021 | -6.07% |
2020 | 18.67% |
2019 | 43.78% |
2018 | -10.66% |
BF.B Dividends
Ex-Dividend Date | Type | Payout Amount | Change | ||||||
---|---|---|---|---|---|---|---|---|---|
Loading, please wait... |
Continue Researching BF.B
Want to see what other sources are saying about Brown Forman Corp's financials and stock price? Try the links below:Brown Forman Corp (BF.B) Stock Price | Nasdaq
Brown Forman Corp (BF.B) Stock Quote, History and News - Yahoo Finance
Brown Forman Corp (BF.B) Stock Price and Basic Information | MarketWatch
Loading social stream, please wait...