Biglari Holdings Inc. Class B (BH): Price and Financial Metrics
BH Price/Volume Stats
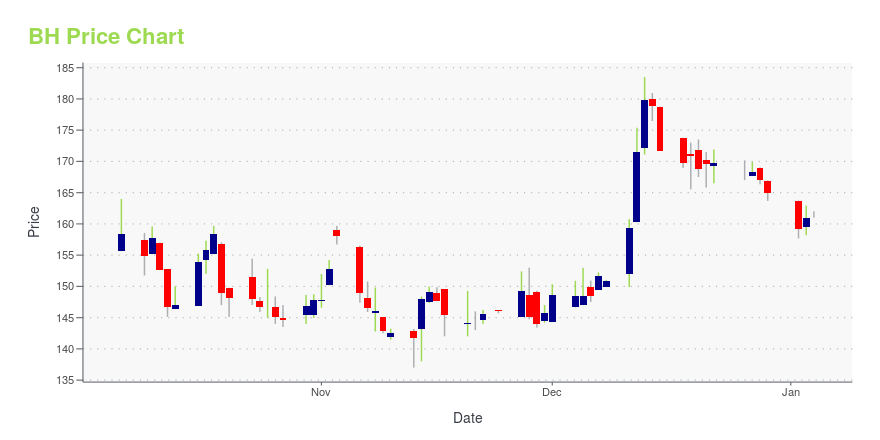
Current price | $165.89 | 52-week high | $218.50 |
Prev. close | $167.08 | 52-week low | $115.22 |
Day low | $164.59 | Volume | 3,800 |
Day high | $170.00 | Avg. volume | 2,681 |
50-day MA | $188.57 | Dividend yield | N/A |
200-day MA | $176.97 | Market Cap | 377.57M |
BH Stock Price Chart Interactive Chart >
BH POWR Grades
- Stability is the dimension where BH ranks best; there it ranks ahead of 89.58% of US stocks.
- The strongest trend for BH is in Stability, which has been heading up over the past 179 days.
- BH's current lowest rank is in the Growth metric (where it is better than 30.19% of US stocks).
BH Stock Summary
- BH's current price/earnings ratio is 3.53, which is higher than only 3.98% of US stocks with positive earnings.
- Price to trailing twelve month operating cash flow for BH is currently 3.08, higher than just 11.42% of US stocks with positive operating cash flow.
- In terms of twelve month growth in earnings before interest and taxes, BIGLARI HOLDINGS INC is reporting a growth rate of -227.55%; that's higher than merely 6.56% of US stocks.
- Stocks with similar financial metrics, market capitalization, and price volatility to BIGLARI HOLDINGS INC are JBLU, BIMI, TCS, UGI, and KNX.
- BH's SEC filings can be seen here. And to visit BIGLARI HOLDINGS INC's official web site, go to www.biglariholdings.com.
BH Valuation Summary
- BH's price/sales ratio is 1.1; this is 57.14% higher than that of the median Consumer Cyclical stock.
- Over the past 243 months, BH's price/earnings ratio has gone down 15.4.
Below are key valuation metrics over time for BH.
Stock | Date | P/S | P/B | P/E | EV/EBIT |
---|---|---|---|---|---|
BH | 2023-09-13 | 1.1 | 0.7 | 3.7 | 3.3 |
BH | 2023-09-12 | 1.1 | 0.7 | 3.7 | 3.3 |
BH | 2023-09-11 | 1.1 | 0.7 | 3.8 | 3.3 |
BH | 2023-09-08 | 1.1 | 0.7 | 3.9 | 3.4 |
BH | 2023-09-07 | 1.1 | 0.7 | 3.9 | 3.4 |
BH | 2023-09-06 | 1.1 | 0.7 | 3.8 | 3.4 |
BH Growth Metrics
- Its 3 year price growth rate is now at 11.4%.
- Its 4 year revenue growth rate is now at -26.33%.
- The 5 year revenue growth rate now stands at -26.33%.

The table below shows BH's growth in key financial areas (numbers in millions of US dollars).
Date | Revenue | Operating Cash Flow | Net Income to Common Stock |
---|---|---|---|
2022-12-31 | 368.231 | 127.825 | -32.018 |
2022-09-30 | 368.721 | 117.276 | -46.896 |
2022-06-30 | 358.77 | 75.763 | -89.57 |
2022-03-31 | 357.19 | 84.561 | -36.527 |
2021-12-31 | 366.106 | 228.767 | 35.478 |
2021-09-30 | 366.804 | 222.434 | 76.63 |
BH's Quality Factors
The “Quality” component of the POWR Ratings focuses on 31 different factors of a companies fundamentals and operational strength. Here are some key insights as we drill into the specifics of these quality attributes.- BH has a Quality Grade of B, ranking ahead of 82.23% of graded US stocks.
- BH's asset turnover comes in at 0.397 -- ranking 53rd of 79 Restaraunts Hotels Motels stocks.
- CHUY, CNNE, and NATH are the stocks whose asset turnover ratios are most correlated with BH.
The table below shows BH's key quality metrics over time.
Period | Asset Turnover | Gross Margin | ROIC |
---|---|---|---|
2021-06-30 | 0.397 | 0.360 | 0.178 |
2021-03-31 | 0.397 | 0.346 | 0.274 |
2020-12-31 | 0.441 | 0.316 | -0.040 |
2020-09-30 | 0.485 | 0.296 | -0.069 |
2020-06-30 | 0.521 | 0.273 | -0.087 |
2020-03-31 | 0.567 | 0.238 | -0.105 |
Biglari Holdings Inc. Class B (BH) Company Bio
Biglari Holdings owns, operates, and franchises restaurants under restaurant concepts, including Steak n Shake. The company was founded in 1934 and is based in San Antonio, Texas.
Latest BH News From Around the Web
Below are the latest news stories about BIGLARI HOLDINGS INC that investors may wish to consider to help them evaluate BH as an investment opportunity.
CBRL: Song Of The South And The Persian BuffettWith the stock being so beat up heading into tomorrow morning’s report, anything decent could spur a relief rally. |
Sardar Biglari Adds El Pollo Loco Holdings Inc to His PortfolioOn August 17, 2023, Sardar Biglari, through his firm Biglari Holdings Inc., made a significant addition to his portfolio by acquiring shares in El Pollo Loco Holdings Inc. This article will delve into the details of this transaction, provide an overview of both Biglari and El Pollo Loco Holdings Inc., and analyze the potential implications of this move for value investors. The transaction involved the addition of 120,000 shares of El Pollo Loco Holdings Inc. to Biglari's portfolio, bringing his total holdings in the company to 4,120,000 shares. |
Estimating The Fair Value Of Biglari Holdings Inc. (NYSE:BH.A)Key Insights Using the 2 Stage Free Cash Flow to Equity, Biglari Holdings fair value estimate is US$835 Current share... |
BIGLARI HOLDINGS INC. NEWS RELEASEBiglari Holdings Inc. (NYSE: BH.A; BH) announces its results for the second quarter and first six months of 2023. |
This Restaurant Investor Isn't Afraid to Play Chicken With El Pollo LocoThe holding company that owns chunks of Cracker Barrel and Jack In The Box now holds a sizable stake in El Pollo Loco. |
BH Price Returns
1-mo | -11.11% |
3-mo | -13.21% |
6-mo | 1.40% |
1-year | 39.39% |
3-year | 82.70% |
5-year | -5.03% |
YTD | 19.52% |
2022 | -2.64% |
2021 | 28.21% |
2020 | -2.81% |
2019 | 0.74% |
2018 | -72.59% |
Continue Researching BH
Want to do more research on Biglari Holdings Inc's stock and its price? Try the links below:Biglari Holdings Inc (BH) Stock Price | Nasdaq
Biglari Holdings Inc (BH) Stock Quote, History and News - Yahoo Finance
Biglari Holdings Inc (BH) Stock Price and Basic Information | MarketWatch
Loading social stream, please wait...