Benchmark Electronics, Inc. (BHE): Price and Financial Metrics
GET POWR RATINGS... FREE!
BHE POWR Grades
- Growth is the dimension where BHE ranks best; there it ranks ahead of 96.72% of US stocks.
- BHE's strongest trending metric is Growth; it's been moving down over the last 177 days.
- BHE ranks lowest in Quality; there it ranks in the 40th percentile.
BHE Stock Summary
- BHE's went public 32.62 years ago, making it older than 85.64% of listed US stocks we're tracking.
- BHE's price/sales ratio is 0.31; that's higher than the P/S ratio of only 8.31% of US stocks.
- With a year-over-year growth in debt of 72.08%, BENCHMARK ELECTRONICS INC's debt growth rate surpasses 84.95% of about US stocks.
- Stocks that are quantitatively similar to BHE, based on their financial statements, market capitalization, and price volatility, are SND, TMST, ZDGE, PETS, and EVC.
- BHE's SEC filings can be seen here. And to visit BENCHMARK ELECTRONICS INC's official web site, go to www.bench.com.
BHE Valuation Summary
- In comparison to the median Technology stock, BHE's price/sales ratio is 85.71% lower, now standing at 0.4.
- Over the past 243 months, BHE's price/sales ratio has gone down 0.2.
Below are key valuation metrics over time for BHE.
Stock | Date | P/S | P/B | P/E | EV/EBIT |
---|---|---|---|---|---|
BHE | 2023-01-31 | 0.4 | 1 | 16.6 | 13.4 |
BHE | 2023-01-30 | 0.3 | 1 | 16.1 | 13.0 |
BHE | 2023-01-27 | 0.3 | 1 | 16.2 | 13.1 |
BHE | 2023-01-26 | 0.4 | 1 | 16.4 | 13.3 |
BHE | 2023-01-25 | 0.4 | 1 | 17.2 | 13.8 |
BHE | 2023-01-24 | 0.4 | 1 | 17.1 | 13.7 |
BHE Growth Metrics
- The 3 year price growth rate now stands at -8.13%.
- Its 5 year revenue growth rate is now at -6.33%.
- The 5 year price growth rate now stands at -35.91%.

The table below shows BHE's growth in key financial areas (numbers in millions of US dollars).
Date | Revenue | Operating Cash Flow | Net Income to Common Stock |
---|---|---|---|
2022-09-30 | 2,768.741 | -126.031 | 59.429 |
2022-06-30 | 2,569.048 | -136.405 | 48.665 |
2022-03-31 | 2,385.681 | -107.26 | 38.813 |
2021-12-31 | 2,255.319 | -2.622 | 35.77 |
2021-09-30 | 2,143.515 | 93.515 | 31.046 |
2021-06-30 | 2,097.584 | 140.793 | 28.896 |
BHE's Quality Factors
The “Quality” component of the POWR Ratings focuses on 31 different factors of a companies fundamentals and operational strength. Here are some key insights as we drill into the specifics of these quality attributes.- BHE has a Quality Grade of C, ranking ahead of 49.45% of graded US stocks.
- BHE's asset turnover comes in at 1.197 -- ranking 32nd of 208 Electronic Equipment stocks.
- BELFA, CASA, and FN are the stocks whose asset turnover ratios are most correlated with BHE.
The table below shows BHE's key quality metrics over time.
Period | Asset Turnover | Gross Margin | ROIC |
---|---|---|---|
2021-09-30 | 1.197 | 0.091 | 0.052 |
2021-06-30 | 1.189 | 0.089 | 0.048 |
2021-03-31 | 1.168 | 0.085 | 0.033 |
2020-12-31 | 1.163 | 0.085 | 0.026 |
2020-09-30 | 1.153 | 0.081 | 0.005 |
2020-06-30 | 1.166 | 0.083 | 0.006 |
BHE Price Target
For more insight on analysts targets of BHE, see our BHE price target page. And for a list of of all stocks sorted by upside potential based on analyst target price, see our Top Price Target page.
Average Price Target | $35.67 | Average Broker Recommendation | 1.33 (Strong Buy) |
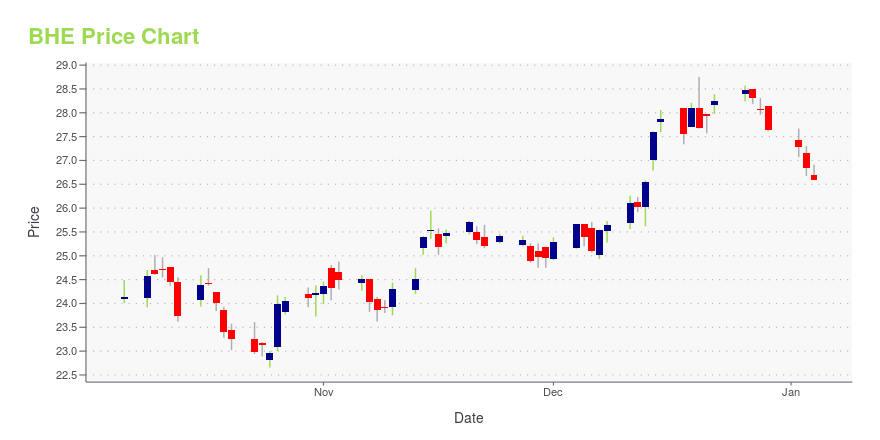
BHE Stock Price Chart Interactive Chart >
BHE Price/Volume Stats
Current price | $25.26 | 52-week high | $30.00 |
Prev. close | $24.77 | 52-week low | $21.11 |
Day low | $24.59 | Volume | 366,800 |
Day high | $25.59 | Avg. volume | 182,022 |
50-day MA | $27.86 | Dividend yield | 2.61% |
200-day MA | $26.13 | Market Cap | 888.55M |
Benchmark Electronics, Inc. (BHE) Company Bio
Benchmark Electronics provides integrated manufacturing, design, and engineering services to original equipment manufacturers of industrial control equipment (which includes equipment for the aerospace and defense industry), telecommunication equipment, computers and related products for business enterprises, medical devices, and testing and instrumentation products. The company was founded in 1979 and is based in Angleton, Texas.
Latest BHE News From Around the Web
Below are the latest news stories about BENCHMARK ELECTRONICS INC that investors may wish to consider to help them evaluate BHE as an investment opportunity.
Benchmark Electronics, Inc. (NYSE:BHE) Q4 2022 Earnings Call TranscriptBenchmark Electronics, Inc. (NYSE:BHE) Q4 2022 Earnings Call Transcript February 1, 2023 Operator: Good day and welcome to the Benchmark Electronics, Inc. Fourth Quarter 2022 Earnings Call. All participants will be in a listen-only mode. After today’s presentation, there will be an opportunity to ask questions. Please note this event is being recorded. I would […] |
BENCHMARK REPORTS RECORD FISCAL YEAR 2022 RESULTSBenchmark Electronics, Inc. (NYSE: BHE) today announced financial results for the fourth quarter and year ended December 31, 2022. |
Earnings grew faster than the 16% return delivered to Benchmark Electronics (NYSE:BHE) shareholders over the last yearThe simplest way to invest in stocks is to buy exchange traded funds. But you can significantly boost your returns by... |
BENCHMARK ELECTRONICS TO REPORT FOURTH QUARTER 2022 RESULTSBenchmark Electronics, Inc. (NYSE: BHE) will announce its fourth quarter 2022 results on Wednesday, February 1, 2023, after the market closes. The Company will host a conference call to discuss the results on the same day at 5:00 p.m. Eastern Time. |
BENCHMARK ANNOUNCES APPOINTMENT OF DOUGLAS BRITT TO THE BOARD OF DIRECTORS AND ANNOUNCES THE RETIREMENT OF BOARD MEMBER DOUGLAS DUNCANBenchmark Electronics, Inc. (NYSE: BHE) today announced the appointment of Douglas Britt as an independent director to the Company's Board of Directors, effective immediately. Benchmark also announced today the retirement of Douglas Duncan, who has served as a board member since 2006, also effective January 9, 2023. |
BHE Price Returns
1-mo | -8.15% |
3-mo | -9.79% |
6-mo | -2.42% |
1-year | 3.26% |
3-year | -10.07% |
5-year | 2.58% |
YTD | -5.36% |
2022 | 1.13% |
2021 | 2.69% |
2020 | -18.97% |
2019 | 65.72% |
2018 | -25.48% |
BHE Dividends
Ex-Dividend Date | Type | Payout Amount | Change | ||||||
---|---|---|---|---|---|---|---|---|---|
Loading, please wait... |
Continue Researching BHE
Want to see what other sources are saying about Benchmark Electronics Inc's financials and stock price? Try the links below:Benchmark Electronics Inc (BHE) Stock Price | Nasdaq
Benchmark Electronics Inc (BHE) Stock Quote, History and News - Yahoo Finance
Benchmark Electronics Inc (BHE) Stock Price and Basic Information | MarketWatch
Loading social stream, please wait...