BHP Group Ltd. ADR (BHP): Price and Financial Metrics
GET POWR RATINGS... FREE!
BHP POWR Grades
- BHP scores best on the Quality dimension, with a Quality rank ahead of 96.87% of US stocks.
- BHP's strongest trending metric is Stability; it's been moving up over the last 179 days.
- BHP ranks lowest in Momentum; there it ranks in the 50th percentile.
BHP Stock Summary
- BHP has a higher market value than 99.67% of US stocks; more precisely, its current market capitalization is $382,863,502,860.
- BHP Group Ltd's stock had its IPO on May 29, 1987, making it an older stock than 91.9% of US equities in our set.
- Of note is the ratio of BHP Group Ltd's sales and general administrative expense to its total operating expenses; merely 0.5% of US stocks have a lower such ratio.
- If you're looking for stocks that are quantitatively similar to BHP Group Ltd, a group of peers worth examining would be XOM, CVX, MA, WMT, and JPM.
- Visit BHP's SEC page to see the company's official filings. To visit the company's web site, go to www.bhp.com.
BHP Valuation Summary
- In comparison to the median Basic Materials stock, BHP's price/earnings ratio is 17.09% higher, now standing at 23.3.
- BHP's price/earnings ratio has moved up 2.5 over the prior 228 months.
- Over the past 228 months, BHP's EV/EBIT ratio has gone down 0.9.
Below are key valuation metrics over time for BHP.
Stock | Date | P/S | P/B | P/E | EV/EBIT |
---|---|---|---|---|---|
BHP | 2021-09-03 | 4.3 | 3.9 | 23.3 | 14.7 |
BHP | 2021-09-02 | 4.2 | 3.8 | 22.9 | 14.5 |
BHP | 2021-09-01 | 4.5 | 4.0 | 24.2 | 15.2 |
BHP | 2021-08-31 | 4.5 | 4.1 | 24.5 | 15.4 |
BHP | 2021-08-30 | 4.6 | 4.2 | 25.1 | 15.7 |
BHP | 2021-08-27 | 4.6 | 4.1 | 24.7 | 15.5 |
BHP Growth Metrics
- The 2 year net income to common stockholders growth rate now stands at 114.74%.
- The 4 year price growth rate now stands at 32.86%.
- Its 4 year net income to common stockholders growth rate is now at 224.6%.

The table below shows BHP's growth in key financial areas (numbers in millions of US dollars).
Date | Revenue | Operating Cash Flow | Net Income to Common Stock |
---|---|---|---|
2021-12-31 | 63,404 | 31,142 | 16,871 |
2021-06-30 | 56,921 | 27,234 | 11,304 |
2021-06-30 | 60,817 | 27,234 | 11,304 |
2021-06-30 | 60,817 | 27,234 | 11,304 |
2020-12-31 | 46,276 | 17,633 | 6,964 |
2020-06-30 | 42,931 | 15,706 | 7,956 |
BHP's Quality Factors
The “Quality” component of the POWR Ratings focuses on 31 different factors of a companies fundamentals and operational strength. Here are some key insights as we drill into the specifics of these quality attributes.- BHP has a Quality Grade of A, ranking ahead of 95.61% of graded US stocks.
- BHP's asset turnover comes in at 0.569 -- ranking 9th of 42 Non-Metallic and Industrial Metal Mining stocks.
- 500 - Internal server error
The table below shows BHP's key quality metrics over time.
Period | Asset Turnover | Gross Margin | ROIC |
---|---|---|---|
2021-06-30 | 0.569 | 1 | 0.234 |
2020-06-30 | 0.418 | 1 | 0.135 |
2019-06-30 | 0.416 | 1 | 0.144 |
2018-06-30 | 0.381 | 1 | 0.104 |
2017-06-30 | 0.325 | 1 | 0.091 |
2016-06-30 | 0.254 | 1 | -0.049 |
BHP Stock Price Chart Interactive Chart >
BHP Price/Volume Stats
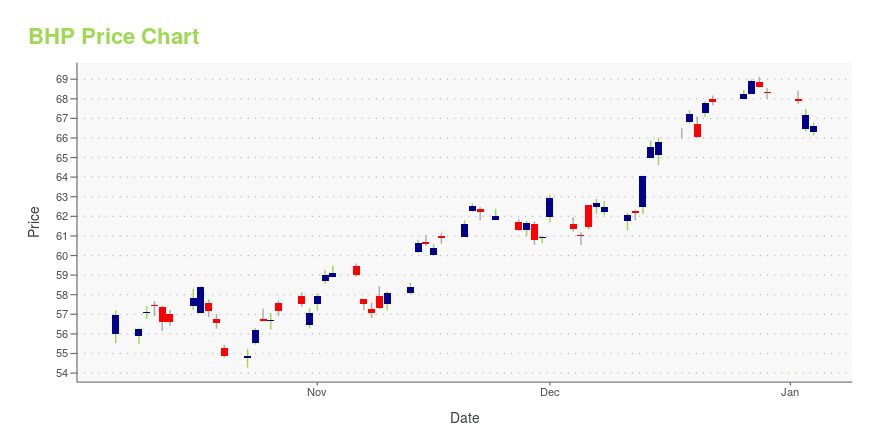
Current price | $54.13 | 52-week high | $80.50 |
Prev. close | $56.18 | 52-week low | $51.88 |
Day low | $52.64 | Volume | 4,125,700 |
Day high | $54.51 | Avg. volume | 4,814,437 |
50-day MA | $64.23 | Dividend yield | 11.08% |
200-day MA | $63.16 | Market Cap | 79.85B |
BHP Group Ltd. ADR (BHP) Company Bio
BHP Group engages in the discovery, acquisition, development, and marketing of natural resources worldwide. It produces iron ore, metallurgical and energy coal, conventional and unconventional oil and gas, copper, aluminum, manganese, uranium, nickel, and silver deposits. The company was founded in 1851 and is based in Melbourne, Australia.
Latest BHP News From Around the Web
Below are the latest news stories about BHP Group Ltd that investors may wish to consider to help them evaluate BHP as an investment opportunity.
Australian shares fall on Ukraine jitters; CIMIC Group soarsAustralian shares dropped nearly 2% on Thursday to hit their lowest in more than two weeks, as Ukraine announced a state of emergency amid rising fears of a full-scale Russian invasion, while CIMIC Group soared over 30% following a bid from Hochtief. The S&P/ASX 200 index was down 1.8% at 7,077.80 by 2329 GMT. The benchmark rose 0.6% on Wednesday. Global markets reacted sharply after Ukraine told its citizens in Russia to immediately come home and the US State Department mentioned that a Russian invasion remained potentially imminent. Australian shares weighed down by tech stocks, Ukraine tensions Miners plunged 3% to their lowest since early February, as iron ore prices slumped on concerns regarding demand prospects in China. Sector heavyweights BHP, Rio Tinto, and Fortescue Metals fel... |
Camber Energy among Energy/Material gainers; BHP Group and Peabody Energy among losersGainers: Indonesia Energy Corporation (INDO) +41%. Camber Energy (CEI) +40% |
Anglo American more than triples annual payout with $6.2bn in dividendsGlobal mining company Anglo American posted record full year earnings of $20.6bn (£15.3bn) and more than tripled its annual payout to shareholders, as soaring commodity prices boosted profits. |
ASX200, CBA, ANZ, Iron Ore, NCM, BHP, FMG, RIO, AUD/USD Elliott Wave Analysis [Video]Australian Stock Market Elliott Wave Analysis Trading Levels ASX 200 Index (XJO), Forex AUDUSD, Commonwealth Bank CBA, BHP Group (BHP), Rio Tinto (RIO … |
Vale-BHP Ore Venture Overhauls $10 Billion Restructuring Proposal(Bloomberg) -- Samarco Mineracao SA, an iron-ore producer jointly owned by Vale SA and BHP Group, presented a new plan to restructure its 50 billion reais ($10 billion) in defaulted debt in an effort to gain support from creditors.Most Read from BloombergSeparatists Launch Attacks; West Vows Sanctions: Ukraine UpdateRussia Attacks Targets Across Ukraine in ‘Dark Day’ for EuropeBiden’s First Salvo of Russia Sanctions Hits With Thud, Not RoarGoldman Sachs Wants Its Bonuses Back as Punishment for J |
BHP Price Returns
1-mo | -19.33% |
3-mo | -22.95% |
6-mo | 3.50% |
1-year | -7.33% |
3-year | 30.81% |
5-year | 154.10% |
YTD | 5.17% |
2021 | 3.56% |
2020 | 25.37% |
2019 | 29.87% |
2018 | 10.55% |
2017 | 33.87% |
BHP Dividends
Ex-Dividend Date | Type | Payout Amount | Change | ||||||
---|---|---|---|---|---|---|---|---|---|
Loading, please wait... |
Continue Researching BHP
Here are a few links from around the web to help you further your research on BHP Group Ltd's stock as an investment opportunity:BHP Group Ltd (BHP) Stock Price | Nasdaq
BHP Group Ltd (BHP) Stock Quote, History and News - Yahoo Finance
BHP Group Ltd (BHP) Stock Price and Basic Information | MarketWatch
Loading social stream, please wait...