Big Lots, Inc. (BIG): Price and Financial Metrics
BIG Price/Volume Stats
Current price | $4.93 | 52-week high | $20.91 |
Prev. close | $5.04 | 52-week low | $4.78 |
Day low | $4.88 | Volume | 999,700 |
Day high | $5.19 | Avg. volume | 1,845,673 |
50-day MA | $7.60 | Dividend yield | N/A |
200-day MA | $10.99 | Market Cap | 143.93M |
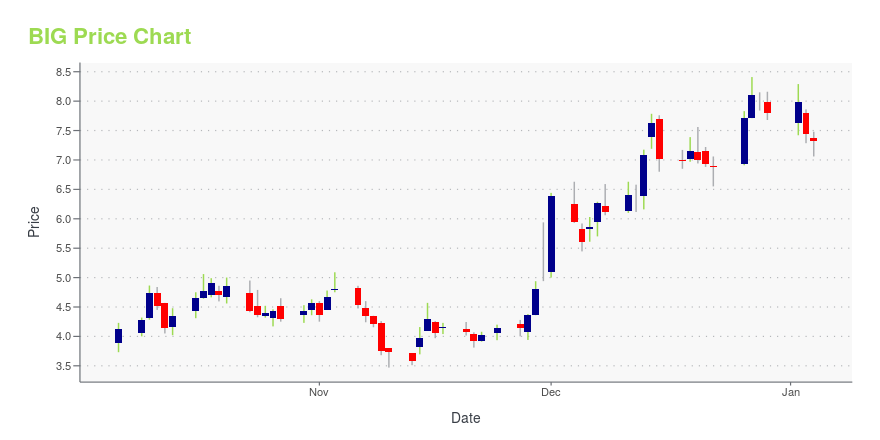
BIG Stock Price Chart Interactive Chart >
BIG POWR Grades
- BIG scores best on the Quality dimension, with a Quality rank ahead of 70.79% of US stocks.
- The strongest trend for BIG is in Stability, which has been heading down over the past 179 days.
- BIG ranks lowest in Sentiment; there it ranks in the 5th percentile.
BIG Stock Summary
- BIG LOTS INC's capital turnover -- a measure of revenue relative to shareholder's equity -- is better than 98% of US listed stocks.
- With a price/sales ratio of 0.03, BIG LOTS INC has a higher such ratio than just 0.53% of stocks in our set.
- Over the past twelve months, BIG has reported earnings growth of 808.34%, putting it ahead of 97.95% of US stocks in our set.
- If you're looking for stocks that are quantitatively similar to BIG LOTS INC, a group of peers worth examining would be DXYN, VIRC, SGRP, SIF, and FORD.
- BIG's SEC filings can be seen here. And to visit BIG LOTS INC's official web site, go to www.biglots.com.
BIG Valuation Summary
- BIG's price/sales ratio is 0; this is 100% lower than that of the median Consumer Defensive stock.
- BIG's price/earnings ratio has moved down 32.3 over the prior 243 months.
Below are key valuation metrics over time for BIG.
Stock | Date | P/S | P/B | P/E | EV/EBIT |
---|---|---|---|---|---|
BIG | 2023-09-08 | 0 | 0.5 | -0.3 | -4.4 |
BIG | 2023-09-07 | 0 | 0.6 | -0.3 | -4.4 |
BIG | 2023-09-06 | 0 | 0.6 | -0.3 | -4.4 |
BIG | 2023-09-05 | 0 | 0.3 | -0.4 | -4.6 |
BIG | 2023-09-01 | 0 | 0.3 | -0.5 | -4.7 |
BIG | 2023-08-31 | 0 | 0.3 | -0.4 | -4.6 |
BIG Growth Metrics
- Its year over year net income to common stockholders growth rate is now at -89.3%.
- Its 2 year cash and equivalents growth rate is now at -80.21%.
- Its 5 year cash and equivalents growth rate is now at 374.47%.

The table below shows BIG's growth in key financial areas (numbers in millions of US dollars).
Date | Revenue | Operating Cash Flow | Net Income to Common Stock |
---|---|---|---|
2022-09-30 | 5,657.237 | -160.983 | -148.407 |
2022-06-30 | 5,788.612 | -83.805 | -49.724 |
2022-03-31 | 5,899.765 | -206.764 | 72.133 |
2021-12-31 | 6,150.603 | 193.762 | 177.778 |
2021-09-30 | 6,156.497 | 207.645 | 225.926 |
2021-06-30 | 6,198.766 | 73.123 | 260.166 |
BIG's Quality Factors
The “Quality” component of the POWR Ratings focuses on 31 different factors of a companies fundamentals and operational strength. Here are some key insights as we drill into the specifics of these quality attributes.- BIG has a Quality Grade of B, ranking ahead of 85.3% of graded US stocks.
- BIG's asset turnover comes in at 1.54 -- ranking 73rd of 165 Retail stocks.
- KR, FAST, and DLTH are the stocks whose asset turnover ratios are most correlated with BIG.
The table below shows BIG's key quality metrics over time.
Period | Asset Turnover | Gross Margin | ROIC |
---|---|---|---|
2021-07-31 | 1.540 | 0.399 | 0.084 |
2021-05-01 | 1.553 | 0.404 | 0.221 |
2021-01-30 | 1.576 | 0.403 | 0.210 |
2020-10-31 | 1.631 | 0.403 | 0.214 |
2020-08-01 | 1.662 | 0.401 | 0.248 |
2020-05-02 | 1.666 | 0.396 | 0.096 |
BIG Price Target
For more insight on analysts targets of BIG, see our BIG price target page. And for a list of of all stocks sorted by upside potential based on analyst target price, see our Top Price Target page.
Average Price Target | $53.89 | Average Broker Recommendation | 2 (Hold) |
Big Lots, Inc. (BIG) Company Bio
Big Lots is a discount retailer with product assortments in the merchandise categories of Food, Consumables, Furniture, Seasonal, Soft Home, Hard Home, and Electronics & Accessories. The company was founded in 1967 and is based in Columbus, Ohio.
Latest BIG News From Around the Web
Below are the latest news stories about BIG LOTS INC that investors may wish to consider to help them evaluate BIG as an investment opportunity.
4 Important Investor Takeways From Retailers' Q2 EarningsLast quarter's reports were all over the map, but they actually make a lot of sense when you step back and look at the bigger picture. |
Inflation May Not Be the Biggest Problem for Retail Stocks Right NowInflation is problematic for all businesses. On Aug. 22, Dick's Sporting Goods (NYSE: DKS) reported its second-quarter earnings numbers, for the period ending July 29. While the sporting goods retailer's revenue of $3.2 billion was relatively resilient and grew by nearly 4% year over year, the company's bottom line totaled $244 million and was down by a mammoth 23%. |
Shoppers pull back on 'big ticket' items as furniture, appliance sales lagRetailers are pointing out the pullback on bigger-ticket item spending. |
Retail earnings point to consumer pullback on furniture, appliancesRecent earnings reports from retailers such as Big Lots (BIG), Home Depot (HD), Lowe's (LOW), and Best Buy (BBY), showed that consumers are pulling back their spending on big-ticket items like appliances and furniture. Yahoo Finance Markets Reporter Ines Ferre explains the consumer shift to "spending more on services and less on goods," as well as how this spending pullback is causing "some cracks in manufacturing," particularly "for the furniture side," with the shutdown of furniture companies United Furniture and Mitchell Gold + Bob Williams. |
Why Big Lots Stock Is a Lot Smaller TodayShares of discount retailer Big Lots (NYSE: BIG) tumbled 12.8% on Wednesday, giving back about half the gains won from Tuesday's big post-earnings stock price rally. Yesterday, if you recall, Big Lots reported a $3.24 per share net loss on a 15% decline in sales to $1.14 billion for its second fiscal quarter of 2023. Bad numbers, to be sure, but it's still better than the $4.12 per share loss and $1.1 billion in sales that Wall Street analysts had predicted. |
BIG Price Returns
1-mo | -19.58% |
3-mo | -46.12% |
6-mo | -52.18% |
1-year | -72.50% |
3-year | -88.25% |
5-year | -85.69% |
YTD | -65.68% |
2022 | -65.65% |
2021 | 7.28% |
2020 | 56.99% |
2019 | 3.60% |
2018 | -46.88% |
Continue Researching BIG
Here are a few links from around the web to help you further your research on Big Lots Inc's stock as an investment opportunity:Big Lots Inc (BIG) Stock Price | Nasdaq
Big Lots Inc (BIG) Stock Quote, History and News - Yahoo Finance
Big Lots Inc (BIG) Stock Price and Basic Information | MarketWatch
Loading social stream, please wait...