
Bank of New York Mellon Corp. (BK): Price and Financial Metrics
BK Price/Volume Stats
| Current price | $65.35 | 52-week high | $65.90 |
| Prev. close | $64.81 | 52-week low | $39.66 |
| Day low | $64.93 | Volume | 3,898,661 |
| Day high | $65.86 | Avg. volume | 3,836,657 |
| 50-day MA | $60.36 | Dividend yield | 2.95% |
| 200-day MA | $54.22 | Market Cap | 48.87B |
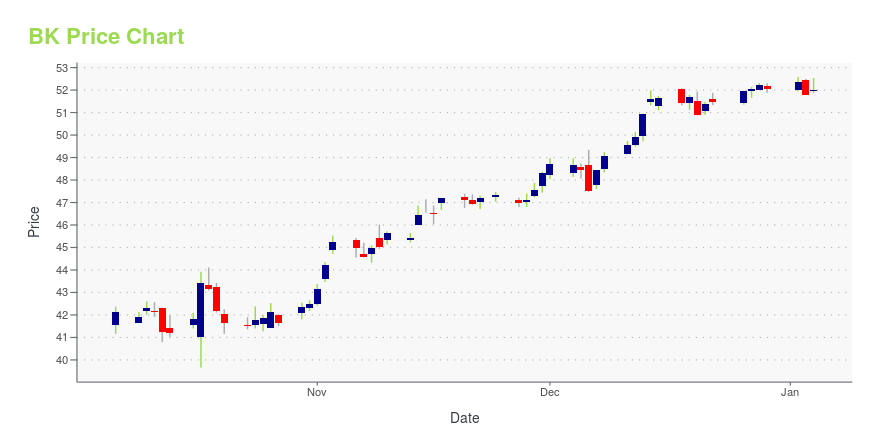
BK Stock Price Chart Interactive Chart >
Bank of New York Mellon Corp. (BK) Company Bio
The Bank of New York Mellon Corporation, commonly known as BNY Mellon, is an American investment banking services holding company headquartered in New York City. BNY Mellon was formed from the merger of The Bank of New York and the Mellon Financial Corporation in 2007. It is the world's largest custodian bank and securities services company,[2][3][4] with $2.4 trillion in assets under management and $46.7 trillion in assets under custody as of the second quarter of 2021.[5][1] It is considered a systemically important bank by the Financial Stability Board. BNY Mellon is incorporated in Delaware. (Source:Wikipedia)
Latest BK News From Around the Web
Below are the latest news stories about BANK OF NEW YORK MELLON CORP that investors may wish to consider to help them evaluate BK as an investment opportunity.
BNY Mellon Municipal Bond Closed-End Funds Declare DistributionsNEW YORK, December 28, 2023--BNY Mellon Investment Adviser, Inc. announced today that BNY Mellon Municipal Income, Inc., BNY Mellon Strategic Municipal Bond Fund, Inc. and BNY Mellon Strategic Municipals, Inc. (each, a "Fund") have declared a monthly distribution for each Fund's common shares as summarized below. The distributions are payable January 31, 2024 to shareholders of record on January 16, 2024, with an ex-dividend date of January 12, 2024. |
With 85% institutional ownership, The Bank of New York Mellon Corporation (NYSE:BK) is a favorite amongst the big gunsKey Insights Given the large stake in the stock by institutions, Bank of New York Mellon's stock price might be... |
Grab These 3 Energy Mutual Funds for Stellar ReturnsBelow, we share with you three energy mutual funds, viz., FSENX, MLPDX and DNLAX. Each has a Zacks Mutual Fund Rank #1. |
14 Best Bank Dividend Stocks To Buy NowIn this article, we discuss 14 best bank dividend stocks to buy now. You can skip our detailed analysis of the banking sector and the performance of bank stocks, and go directly to read 5 Best Bank Dividend Stocks To Buy Now. During most of the 2022 market decline, financial stocks were seen as a […] |
11 Most Profitable Bank Stocks To Invest InIn this piece, we will take a look at the 11 most profitable bank stocks to invest in. If you want to skip out on our introduction to the banking industry and the stock market, then head on over to 5 Most Profitable Bank Stocks To Invest In. The banking industry has been at the […] |
BK Price Returns
| 1-mo | 12.23% |
| 3-mo | 14.87% |
| 6-mo | 19.87% |
| 1-year | 49.57% |
| 3-year | 43.22% |
| 5-year | 60.35% |
| YTD | 28.41% |
| 2023 | 18.52% |
| 2022 | -19.14% |
| 2021 | 40.55% |
| 2020 | -12.91% |
| 2019 | 9.56% |
BK Dividends
| Ex-Dividend Date | Type | Payout Amount | Change | ||||||
|---|---|---|---|---|---|---|---|---|---|
| Loading, please wait... | |||||||||
Continue Researching BK
Want to see what other sources are saying about Bank of New York Mellon Corp's financials and stock price? Try the links below:Bank of New York Mellon Corp (BK) Stock Price | Nasdaq
Bank of New York Mellon Corp (BK) Stock Quote, History and News - Yahoo Finance
Bank of New York Mellon Corp (BK) Stock Price and Basic Information | MarketWatch
Loading social stream, please wait...