The Buckle Inc. (BKE): Price and Financial Metrics
GET POWR RATINGS... FREE!
BKE POWR Grades
- Quality is the dimension where BKE ranks best; there it ranks ahead of 99.02% of US stocks.
- The strongest trend for BKE is in Growth, which has been heading up over the past 177 days.
- BKE ranks lowest in Stability; there it ranks in the 35th percentile.
BKE Stock Summary
- The capital turnover (annual revenue relative to shareholder's equity) for BKE is 3.04 -- better than 83.13% of US stocks.
- Of note is the ratio of BUCKLE INC's sales and general administrative expense to its total operating expenses; 87.12% of US stocks have a lower such ratio.
- Shareholder yield, a measure of how much is returned to shareholders via dividends and share repurchases, for BKE comes in at 20.18% -- higher than that of 91.03% of stocks in our set.
- If you're looking for stocks that are quantitatively similar to BUCKLE INC, a group of peers worth examining would be KRT, MYE, LZB, DTEA, and LRN.
- BKE's SEC filings can be seen here. And to visit BUCKLE INC's official web site, go to www.buckle.com.
BKE Valuation Summary
- BKE's EV/EBIT ratio is 5.1; this is 60.77% lower than that of the median Consumer Cyclical stock.
- Over the past 243 months, BKE's price/sales ratio has gone up 0.4.
Below are key valuation metrics over time for BKE.
Stock | Date | P/S | P/B | P/E | EV/EBIT |
---|---|---|---|---|---|
BKE | 2023-03-22 | 1.3 | 4.0 | 6.9 | 5.1 |
BKE | 2023-03-21 | 1.3 | 4.1 | 7.1 | 5.2 |
BKE | 2023-03-20 | 1.3 | 4.0 | 7.0 | 5.2 |
BKE | 2023-03-17 | 1.3 | 4.0 | 7.0 | 5.2 |
BKE | 2023-03-16 | 1.4 | 4.2 | 7.2 | 5.3 |
BKE | 2023-03-15 | 1.4 | 4.2 | 7.2 | 5.4 |
BKE Growth Metrics
- The 3 year cash and equivalents growth rate now stands at 35.95%.
- Its year over year revenue growth rate is now at 20.24%.
- Its 5 year revenue growth rate is now at -13.7%.

The table below shows BKE's growth in key financial areas (numbers in millions of US dollars).
Date | Revenue | Operating Cash Flow | Net Income to Common Stock |
---|---|---|---|
2022-09-30 | 1,324.311 | 225.792 | 250.699 |
2022-06-30 | 1,311.402 | 244.779 | 251.53 |
2022-03-31 | 1,304.546 | 239.722 | 252.805 |
2021-12-31 | 1,294.607 | 311.754 | 254.82 |
2021-09-30 | 1,232.512 | 322.146 | 236.511 |
2021-06-30 | 1,164.085 | 314.721 | 215.929 |
BKE's Quality Factors
The “Quality” component of the POWR Ratings focuses on 31 different factors of a companies fundamentals and operational strength. Here are some key insights as we drill into the specifics of these quality attributes.- BKE has a Quality Grade of A, ranking ahead of 99.78% of graded US stocks.
- BKE's asset turnover comes in at 1.296 -- ranking 104th of 165 Retail stocks.
- DKS, WSM, and KIRK are the stocks whose asset turnover ratios are most correlated with BKE.
The table below shows BKE's key quality metrics over time.
Period | Asset Turnover | Gross Margin | ROIC |
---|---|---|---|
2021-07-31 | 1.296 | 0.490 | 0.457 |
2021-05-01 | 1.234 | 0.481 | 0.396 |
2021-01-30 | 1.060 | 0.445 | 0.237 |
2020-10-31 | 0.997 | 0.429 | 0.189 |
2020-08-01 | 0.966 | 0.414 | 0.153 |
2020-05-02 | 0.947 | 0.402 | 0.118 |
BKE Price Target
For more insight on analysts targets of BKE, see our BKE price target page. And for a list of of all stocks sorted by upside potential based on analyst target price, see our Top Price Target page.
Average Price Target | $14.00 | Average Broker Recommendation | 2 (Hold) |
BKE Stock Price Chart Interactive Chart >
BKE Price/Volume Stats
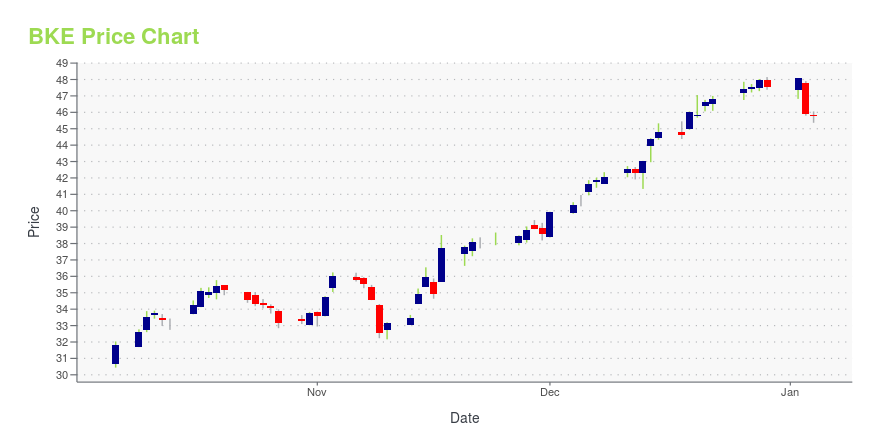
Current price | $35.38 | 52-week high | $50.35 |
Prev. close | $34.83 | 52-week low | $26.50 |
Day low | $34.91 | Volume | 116,849 |
Day high | $35.41 | Avg. volume | 485,568 |
50-day MA | $39.70 | Dividend yield | 4% |
200-day MA | $37.08 | Market Cap | 1.77B |
The Buckle Inc. (BKE) Company Bio
Buckle Inc. offers apparel, accessories, and footwear, catering to fashion-conscious young men and women. The company was founded in 1948 and is based in Kearney, Nebraska.
Latest BKE News From Around the Web
Below are the latest news stories about BUCKLE INC that investors may wish to consider to help them evaluate BKE as an investment opportunity.
The Buckle, Inc. Reports Quarterly DividendKEARNEY, Neb., March 21, 2023--THE BUCKLE, INC. REPORTS QUARTERLY DIVIDEND |
The 7 Best Investments for Passive Income in 2023With the latest economic shock stemming from a major bank run, these are the best investments for passive income under the circumstances. |
The Buckle, Inc. (NYSE:BKE) Q4 2022 Earnings Call TranscriptThe Buckle, Inc. (NYSE:BKE) Q4 2022 Earnings Call Transcript March 10, 2023 Operator: Well, good morning, everyone, and thank you for standing by. And welcome to Buckle’s Fourth Quarter Earnings Release Webcast. As a reminder, all participants are currently in a listen-only mode. A question-and-answer session will be conducted following the company’s prepared remarks with […] |
Q4 2022 Buckle Inc Earnings CallQ4 2022 Buckle Inc Earnings Call |
The 3 Best Dividend Stocks to Buy for 2023The best dividend stocks to own for 2023 are companies increasing dividends while also generating healthy capital appreciation over time. |
BKE Price Returns
1-mo | -13.79% |
3-mo | -16.98% |
6-mo | 20.17% |
1-year | 17.92% |
3-year | 263.36% |
5-year | 173.74% |
YTD | -16.98% |
2022 | 10.91% |
2021 | 69.97% |
2020 | 25.01% |
2019 | 55.19% |
2018 | -7.63% |
BKE Dividends
Ex-Dividend Date | Type | Payout Amount | Change | ||||||
---|---|---|---|---|---|---|---|---|---|
Loading, please wait... |
Continue Researching BKE
Want to see what other sources are saying about Buckle Inc's financials and stock price? Try the links below:Buckle Inc (BKE) Stock Price | Nasdaq
Buckle Inc (BKE) Stock Quote, History and News - Yahoo Finance
Buckle Inc (BKE) Stock Price and Basic Information | MarketWatch
Loading social stream, please wait...