BlackRock, Inc. (BLK): Price and Financial Metrics
BlackRock, Inc. (BLK)
Today's Latest Price: $721.79 USD
Updated Jan 25 3:27pm
Add BLK to WatchlistSign Up
POWR Components:
Trade Grade Buy & Hold Grade Peer Grade Industry Rank
Industry Rank:
Ranked of 69 in Asset Management
See all "A" rated Strong Buy stocks
BLK Stock Summary
- With a market capitalization of $112,102,995,180, BlackRock Inc has a greater market value than 98.08% of US stocks.
- With a one year PEG ratio of 268.97, BlackRock Inc is expected to have a higher PEG ratio (a measure of how expensive a stock is relative to its expected earnings growth) than 86.98% of US stocks.
- Price to trailing twelve month operating cash flow for BLK is currently 37.12, higher than 86.74% of US stocks with positive operating cash flow.
- If you're looking for stocks that are quantitatively similar to BlackRock Inc, a group of peers worth examining would be SCHW, AXP, SE, CVS, and TGT.
- Visit BLK's SEC page to see the company's official filings. To visit the company's web site, go to www.blackrock.com.
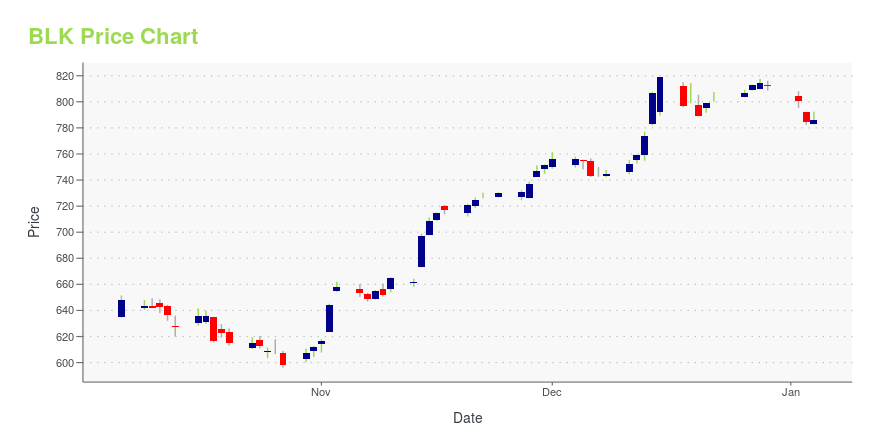
BLK Stock Price Chart Interactive Chart >
BLK Price/Volume Stats
Current price | $721.79 | 52-week high | $788.00 |
Prev. close | $735.05 | 52-week low | $323.98 |
Day low | $713.62 | Volume | 610,677 |
Day high | $735.77 | Avg. volume | 756,348 |
50-day MA | $710.03 | Dividend yield | 1.98% |
200-day MA | $596.53 | Market Cap | 110.08B |
BlackRock, Inc. (BLK) Company Bio
Blackrock provides financial services to institutional, intermediary, and individual investors with products that include separate accounts, mutual funds, iShares (exchange-traded funds), and other pooled investment vehicles. The company was founded in 1988 and is based in New York City.
BLK Price Forecast Based on DCF Valuation
Current Price | DCF Fair Value Target: | Forecasted Gain: |
$721.79 | $138.42 | -81% |
We started the process of determining a valid price forecast for BlackRock Inc with a discounted cash flow analysis -- the results of which can be found in the table below. To summarize, we found that BlackRock Inc ranked in the 18th percentile in terms of potential gain offered. We should note, though, that the most conservative analysis suggests this stock will yield negative results -- and thus may be a potential short opportunity. In terms of the factors that were most noteworthy in this DCF analysis for BLK, they are:
- The company has produced more trailing twelve month cash flow than 89.03% of its sector Financial Services.
- The business' balance sheet suggests that 6% of the company's capital is sourced from debt; this is greater than just 19.22% of the free cash flow producing stocks we're observing.
- BLK's estimated cost of debt, based largely on its market capitalization and its interest coverage ratio, is 3%; for context, that number is higher than 41.17% of tickers in our DCF set.
Terminal Growth Rate in Free Cash Flow | Return Relative to Current Share Price |
0% | -82% |
1% | -81% |
2% | -81% |
3% | -81% |
4% | -81% |
5% | -81% |
AXS, ARGO, FCRD, MKTX, and GSHD can be thought of as valuation peers to BLK, in the sense that they are in the Financial Services sector and have a similar price forecast based on DCF valuation.
Loading social stream, please wait...