Badger Meter, Inc. (BMI): Price and Financial Metrics
BMI Price/Volume Stats
Current price | $150.77 | 52-week high | $151.09 |
Prev. close | $146.33 | 52-week low | $73.20 |
Day low | $146.77 | Volume | 270,100 |
Day high | $151.09 | Avg. volume | 149,134 |
50-day MA | $132.76 | Dividend yield | 0.62% |
200-day MA | $115.03 | Market Cap | 4.42B |
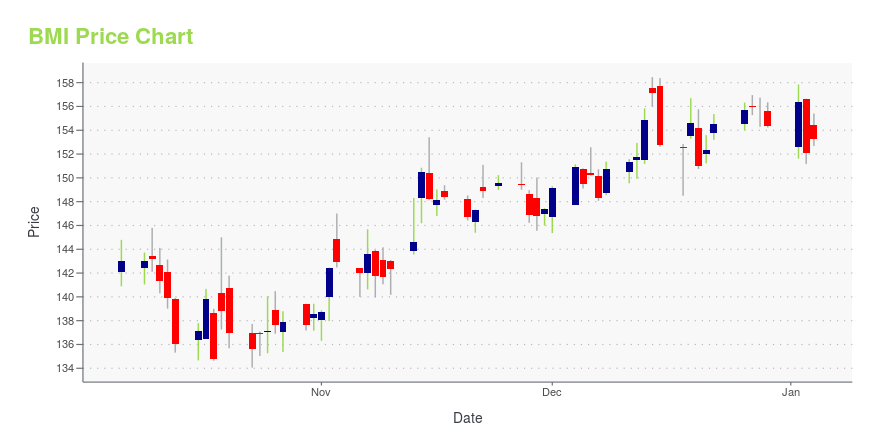
BMI Stock Price Chart Interactive Chart >
BMI POWR Grades
- BMI scores best on the Quality dimension, with a Quality rank ahead of 97.95% of US stocks.
- BMI's strongest trending metric is Momentum; it's been moving up over the last 179 days.
- BMI's current lowest rank is in the Value metric (where it is better than 3.65% of US stocks).
BMI Stock Summary
- BMI's one year PEG ratio, measuring expected growth in earnings next year relative to current common stock price is 331.59 -- higher than 92.69% of US-listed equities with positive expected earnings growth.
- BMI's went public 37.42 years ago, making it older than 93.61% of listed US stocks we're tracking.
- The ratio of debt to operating expenses for BADGER METER INC is higher than it is for about merely 0.41% of US stocks.
- If you're looking for stocks that are quantitatively similar to BADGER METER INC, a group of peers worth examining would be FELE, LANC, TR, PSN, and IPAR.
- Visit BMI's SEC page to see the company's official filings. To visit the company's web site, go to www.badgermeter.com.
BMI Valuation Summary
- In comparison to the median Industrials stock, BMI's price/earnings ratio is 218.58% higher, now standing at 58.3.
- Over the past 243 months, BMI's price/earnings ratio has gone up 42.8.
Below are key valuation metrics over time for BMI.
Stock | Date | P/S | P/B | P/E | EV/EBIT |
---|---|---|---|---|---|
BMI | 2023-05-19 | 7.0 | 9.1 | 58.3 | 43.3 |
BMI | 2023-05-18 | 7.0 | 9.0 | 57.6 | 42.8 |
BMI | 2023-05-17 | 6.9 | 8.9 | 56.9 | 42.3 |
BMI | 2023-05-16 | 6.8 | 8.8 | 56.3 | 41.7 |
BMI | 2023-05-15 | 6.8 | 8.8 | 56.4 | 41.8 |
BMI | 2023-05-12 | 6.8 | 8.8 | 56.4 | 41.9 |
BMI Growth Metrics
- Its 5 year revenue growth rate is now at 8.47%.
- The year over year net income to common stockholders growth rate now stands at 19.88%.
- The 3 year revenue growth rate now stands at 19.88%.

The table below shows BMI's growth in key financial areas (numbers in millions of US dollars).
Date | Revenue | Operating Cash Flow | Net Income to Common Stock |
---|---|---|---|
2022-12-31 | 565.568 | 82.451 | 66.496 |
2022-09-30 | 553.993 | 77.493 | 66.233 |
2022-06-30 | 534.722 | 71.353 | 64.155 |
2022-03-31 | 519.758 | 66.204 | 61.463 |
2021-12-31 | 505.198 | 87.51 | 60.884 |
2021-09-30 | 481.779 | 78.66 | 56.702 |
BMI's Quality Factors
The “Quality” component of the POWR Ratings focuses on 31 different factors of a companies fundamentals and operational strength. Here are some key insights as we drill into the specifics of these quality attributes.- BMI has a Quality Grade of A, ranking ahead of 95.47% of graded US stocks.
- BMI's asset turnover comes in at 0.977 -- ranking 11th of 75 Measuring and Control Equipment stocks.
- BRKR, TT, and HURC are the stocks whose asset turnover ratios are most correlated with BMI.
The table below shows BMI's key quality metrics over time.
Period | Asset Turnover | Gross Margin | ROIC |
---|---|---|---|
2021-09-30 | 0.977 | 0.404 | 0.378 |
2021-06-30 | 0.981 | 0.404 | 0.389 |
2021-03-31 | 0.944 | 0.401 | 0.363 |
2020-12-31 | 0.952 | 0.395 | 0.353 |
2020-09-30 | 0.967 | 0.393 | 0.344 |
2020-06-30 | 0.973 | 0.390 | 0.317 |
BMI Price Target
For more insight on analysts targets of BMI, see our BMI price target page. And for a list of of all stocks sorted by upside potential based on analyst target price, see our Top Price Target page.
Average Price Target | $97.75 | Average Broker Recommendation | 1.93 (Hold) |
Badger Meter, Inc. (BMI) Company Bio
Badger Meter Inc. offers flow measurement and control products, serving water utilities, municipalities, and commercial and industrial customers worldwide. The Company's products measure water, oil, chemicals, and other fluids, and are known for accuracy, long-lasting durability and for providing valuable and timely measurement data. The company was founded in 1905 and is based in Milwaukee, Wisconsin.
Latest BMI News From Around the Web
Below are the latest news stories about BADGER METER INC that investors may wish to consider to help them evaluate BMI as an investment opportunity.
Itron (ITRI) New Edge Gateway to Promote Utility DigitalizationItron (ITRI) launches Edge Gateway product line to facilitate efficient and sustainable management of energy. |
Lumen (LUMN) Holds Investor Day: Key Takeaways & ObjectivesLumen (LUMN) is set to achieve its key financial objectives by investing in customer experience, optimizing sales and channel operations, and embracing innovation. |
Orange (ORAN) Buys Stake in VOO SA to Boost Network ExpansionOrange (ORAN) acquires a major stake in VOO SA to strengthen its position in Wallonia and Brussels. |
Telefonica (TEF) Gains 16.8% YTD: Will the Trend Continue?Telefonica's (TEF) performance benefits from strong revenue growth across Telefonica Brazil and the Telefonica Tech business segments. |
BCE Expands Cloud Solutions Portfolio With FX Innovation BuyoutBCE completes the acquisition of FX Innovation to assist Canadian businesses in achieving their digital transformation goals. |
BMI Price Returns
1-mo | 9.38% |
3-mo | 30.74% |
6-mo | 29.84% |
1-year | 88.12% |
3-year | 131.32% |
5-year | 257.50% |
YTD | 38.77% |
2022 | 3.23% |
2021 | 14.11% |
2020 | 46.37% |
2019 | 33.46% |
2018 | 4.09% |
BMI Dividends
Ex-Dividend Date | Type | Payout Amount | Change | ||||||
---|---|---|---|---|---|---|---|---|---|
Loading, please wait... |
Continue Researching BMI
Want to do more research on Badger Meter Inc's stock and its price? Try the links below:Badger Meter Inc (BMI) Stock Price | Nasdaq
Badger Meter Inc (BMI) Stock Quote, History and News - Yahoo Finance
Badger Meter Inc (BMI) Stock Price and Basic Information | MarketWatch
Loading social stream, please wait...