
BioMarin Pharmaceutical Inc (BMRN): Price and Financial Metrics
BMRN Price/Volume Stats
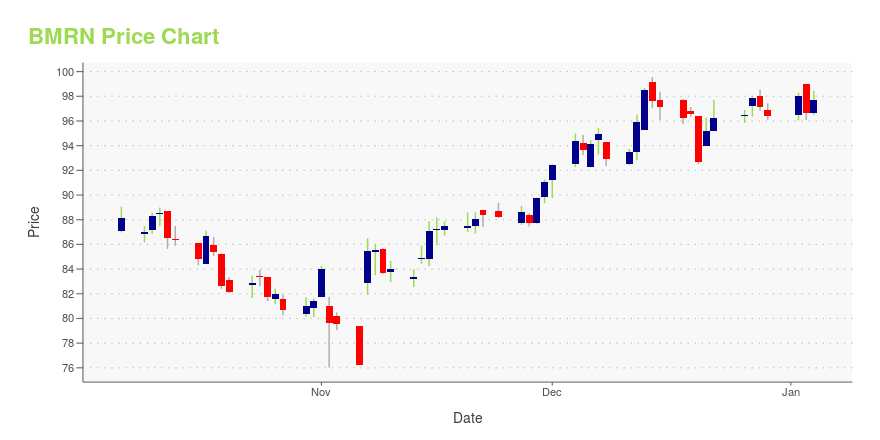
| Current price | $84.59 | 52-week high | $99.56 |
| Prev. close | $85.59 | 52-week low | $73.68 |
| Day low | $84.07 | Volume | 1,063,391 |
| Day high | $86.45 | Avg. volume | 1,894,861 |
| 50-day MA | $81.63 | Dividend yield | N/A |
| 200-day MA | $86.74 | Market Cap | 16.06B |
BMRN Stock Price Chart Interactive Chart >
BioMarin Pharmaceutical Inc (BMRN) Company Bio
BioMarin Pharmaceutical Inc. is an American biotechnology company headquartered in San Rafael, California. It has offices and facilities in the United States, South America, Asia, and Europe. BioMarin's core business and research is in enzyme replacement therapies (ERTs). BioMarin was the first company to provide therapeutics for mucopolysaccharidosis type I (MPS I), by manufacturing laronidase (Aldurazyme, commercialized by Genzyme Corporation). BioMarin was also the first company to provide therapeutics for phenylketonuria (PKU). (Source:Wikipedia)
Latest BMRN News From Around the Web
Below are the latest news stories about BIOMARIN PHARMACEUTICAL INC that investors may wish to consider to help them evaluate BMRN as an investment opportunity.
BioMarin strikes deal with Elliott, agrees to review businessUnder pressure from the activist investor, BioMarin will add more independent directors and set up an operational review committee. |
BioMarin settles with Elliott, adds 3 independent directorsBioMarin reached a settlement with activist investor Elliott Investment Management where the biotechnology company will add three independent directors to its board and form a committee to review operations. The new Strategic and Operating Review Committee will evaluate the company's business, strategy and operations, financial and capital allocation priorities, and long-term planning and priorities, the company said in a statement. In November, Reuters reported that Elliott owns a stake in BioMarin and had been holding discussions with the company, valued at $18 billion, about possible changes. |
BioMarin Announces Governance Enhancements and Value Creation InitiativesBioMarin Pharmaceutical Inc. (NASDAQ: BMRN), a global biotechnology company dedicated to transforming lives through genetic discovery, today announced several initiatives to enhance corporate governance and long-term shareholder value creation. |
Insider Sell: EVP, Chief Legal Officer George Davis Sells 13,764 Shares of Biomarin ...Biomarin Pharmaceutical Inc (NASDAQ:BMRN), a global biotechnology company focused on developing and delivering therapies for rare genetic diseases, has recently witnessed a significant insider sell by one of its top executives. |
Is BioMarin Pharmaceutical Inc. (NASDAQ:BMRN) Trading At A 49% Discount?Key Insights The projected fair value for BioMarin Pharmaceutical is US$193 based on 2 Stage Free Cash Flow to Equity... |
BMRN Price Returns
| 1-mo | -0.77% |
| 3-mo | 4.55% |
| 6-mo | -6.91% |
| 1-year | -2.28% |
| 3-year | 7.99% |
| 5-year | 4.29% |
| YTD | -12.27% |
| 2023 | -6.83% |
| 2022 | 17.14% |
| 2021 | 0.75% |
| 2020 | 3.71% |
| 2019 | -0.70% |
Continue Researching BMRN
Here are a few links from around the web to help you further your research on Biomarin Pharmaceutical Inc's stock as an investment opportunity:Biomarin Pharmaceutical Inc (BMRN) Stock Price | Nasdaq
Biomarin Pharmaceutical Inc (BMRN) Stock Quote, History and News - Yahoo Finance
Biomarin Pharmaceutical Inc (BMRN) Stock Price and Basic Information | MarketWatch
Loading social stream, please wait...